Section 1: Introduction
|
||||||||||||||||||||||||||||||||||||||||||||||||||||||||||||||||||||||||||||||||||||||||||||||||||||||||||||||||||||||||||||||||||||||||||||||||||||||||||||||||||||||||||||||||||||||||||||||||||||||||||||||||||||||||||||||||||||||||||||||||||||||||||||||||||||||||||||||||||||||||||||||||||||||||||||||||||||||||||||||||||||||||||||||||||||||||||||||||||||||||||||||||||||||||||||||||||||||||||||||||||||||||||||||||||||||||||||||||||||||||||||||||||||||||||||||||||||||||||||||||||||||||||||||||||||||||||||||||||||||||||||||||||||||||||||||||||||||||||||||||||||||||

|
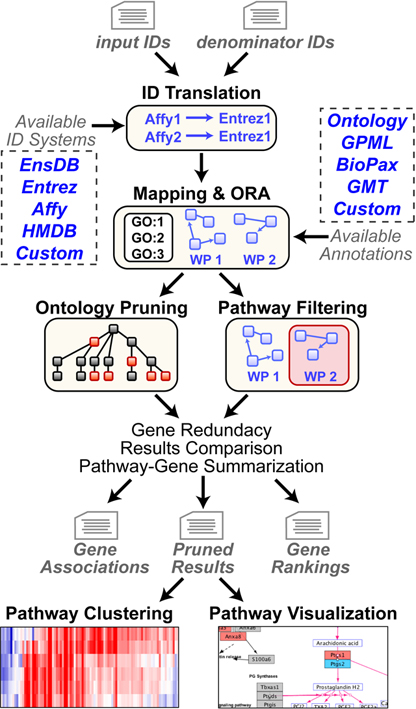
Figure 1. GO-Elite workflow and information sources. Before running ORA, users format two text files containing a list of input IDs (e.g., regulated genes) and a denominator list (e.g., all genes examined), along with a second column indicating the ID type (e.g., Affymetrix). In GO-Elite, these IDs are mapped to a primary ID system (EntrezGene, Ensembl, HMD or custom) for ORA upon pathways, ontologies or loaded gene sets. Filtered pathway results produced in either the stand-alone version of GO-Elite or the GenMAPP-CS GO-Elite plugin can be selected to immediately view the pathway (e.g., WikiPathways (WP)) and regulated genes. Alternatively, pathway or ontology summarized expression values can be clustered and visualized outside of GO-Elite.
Section 2: Running GO-Elite
Analysis in GenMAPP-CS
GenMAPP-CS is a user-friendly application built within Cytoscape designed to automate high-throughput gene-data analyses. GO-Elite can be run after a user installs GenMAPP-CS, imports their gene data (e.g., gene expression data) and establishes criterion for visualization. No manually created input or denominator files need to be created. When using GenMAPP-CS the first time we recommend:
1) Download GenMAPP-CS from: http://www.genmapp.org/beta/genmappcs/
2) Go to the tutorials by selecting the link “Learn to Use GenMAPP”
3) Go through the first tutorial “Expression data visualization and analysis” to import the sample or your own data for the associated species.
4)
Go
through the GO-Elite tutorial (Over-representation analysis) with the
criterion established in the first tutorial section (Figure 2).
While the primary input to the GO-Elite plugin is specific GenMAPP-CS criterion, users can also selected nodes from a large network as their input or provide text input and denominator files similar to the other implementations of GO-Elite. These options are available when selecting the GO-Elite Action button.
|
|
|
Figure 2. Analysis and Visualization of GO-Elite Results. GO-Elite results are displayed in the right hand results panel of GenMAPP-CS (built in Cytoscape). Yellow highlighted terms are those meeting all filtering options and represented the selected pruned GO terms (not applicable in this screen shot). GO-Elite is run as a drop-down selection from the Actions menu of GenMAPP-CS (Left panel). Visualization of WikiPathway over-represented GO-Elite terms is in the central network panel. |
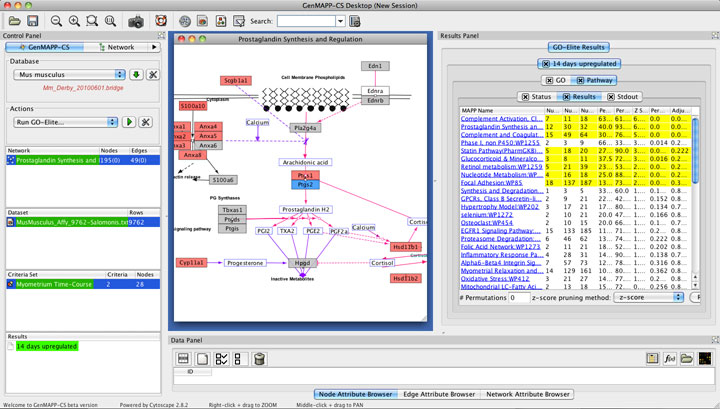
Results are only provided for Gene Ontology terms and WikiPathways, which are run as separate queries to facilitate immediate access to WikiPathways results (Gene Ontology results take longer). By default, the GO-Elite plugin performs zero permutations and hence does not calculate a permutated or adjusted p-value, just an over-representation Z score to facilitate fast runtimes. Once run, these results can be adjusted by simply adding additional options at the bottom of the GO-Elite results panel (e.g., require permutations and change the pruning method). These tabular results can be exported to the users computer using the export option in the GO-Elite results panel, exporting the pathway image, or viewing the full web-service GO-Elite results directory online from the associated URL in the “Status” tab of the results panel. The latter will include full gene associations for all GO terms and pathways.
GO-Elite Input Files
When using the stand-alone or web versions of GO-Elite, the user has to provide two files: (A) input list and (B) denominator ID list, containing all input IDs and all examined ID, respectively. In the stand-alone version, more than one input and denominator file can be analyzed in a single run by including multiple files within designated target directories.
Preparing Your ID Lists
To perform ORA in GO-Elite, you need to provide at least one input ID list and denominator list. The input list is a subset of the denominator list that consists of gene IDs or metabolites that are highlighted from a user analysis (e.g., up and downregulated Agilent IDs). Both input and denominator lists typically consist of a column of gene or metabolite IDs (column 1), system code for each ID (column 2) and any other data you may wish to summarize at the pathway level (e.g. fold change). To find out what system code corresponds to your gene data, start GO-Elite, select the option “Analyze ID Lists” and select the button named “GO-Elite Supported System Codes” at the bottom of the interface. A list of all current supported system codes for GO-Elite can be found at the end of Section 5 in this document (Table 2). Commonly used system codes are “X” for Affymetrix, “L” for EntrezGene, “En” for Ensembl and "Ca" for CAS (Section 5 - System Codes). If your array is not one of the supported array types (Affymetrix, Agilent, Codelink and Illumina), the system "Ma" for Miscellaneous Array may contain your array system (see http://www.ensembl.org/biomart/martview). Currently, GO-Elite can only accept one system code per file. If the system code column is not present, GO-Elite may be able to guess what type of ID system it is, but this is not always appropriate and is typically not recommended. For the denominator file, only the first two columns are used (gene IDs and system code). If you have multiple input files in a single directory that corresponds to different denominator files, GO-Elite will properly match these up if you place a unique number, letter or name before the name of each input file, separated by a period (e.g. exp1.input.txt and exp2.input.txt) and denominator file that matches it (e.g., exp1.denominator.txt and exp2.denominator.txt).
|
Source Identifier (REQUIRED) |
SystemCode (RECOMMENDED) |
Fold TP1 (OPTIONAL) |
Fold TP2 (OPTIONAL) |
|
j05479_s_at |
X |
1.23 |
2.31 |
|
L49502_s_at |
X |
-1.92 |
-1.85 |
|
Msa.33069.0_s_at |
X |
-2.41 |
-1.33 |
|
Msa.37566.0_s_at |
X |
3.03 |
0.25 |
|
AF028071_s_at |
X |
-1.91 |
0.85 |
Table 1. Example Input ID List Format. Sample data for an Affymetrix microarray experiment (column 1=probeset, column2=Affymetrix System Code). Denominator file must contain a similar structure without the optional fields.
Using the GO-Elite Web Interface
In addition to the stand-alone GO-Elite program, a simple query interface is available over the internet that does not require the user to download any software. This interface has all basic analysis features for GO-Elite, however, it is not possible to modify or add new database information (e.g., new gene systems or species support). The online interface supports all default species and ID systems (e.g., Affymetrix probeset IDs, HMDB and Ensembl). If performing different analyses from these, we recommend downloading the GO-Elite software to your computer.
|
species_code |
species_name |
tax_id |
compatible algorithms |
|
Aa |
Aedes aegypti |
7159 |
En|Ch |
|
Ac |
Anolis carolinensis |
28377 |
En|Ch |
|
Ag |
Anopheles gambiae |
7165 |
En|L|Ch |
|
At |
Arabidopsis thaliana |
3702 |
En|L|Ch |
|
Bt |
Bos taurus |
9913 |
En|Ch |
|
Ce |
Caenorhabditis elegans |
6239 |
En|Ch |
|
Cf |
Canis familiaris |
9615 |
En|Ch |
|
Ch |
Choloepus hoffmanni |
9358 |
En|Ch |
|
Ci |
Ciona intestinalis |
7719 |
En|Ch |
|
Cj |
Callithrix jacchus |
9483 |
En|Ch |
|
Cp |
Cavia porcellus |
10141 |
En|Ch |
|
Cs |
Ciona savignyi |
51511 |
En|Ch |
|
Dm |
Drosophila melanogaster |
7227 |
En|Ch |
|
Dn |
Dasypus novemcinctus |
9361 |
En|Ch |
|
Do |
Dipodomys ordii |
10020 |
En|Ch |
|
Dr |
Danio rerio |
7955 |
En|L|Ch |
|
Ec |
Equus caballus |
9796 |
En|Ch |
|
Ee |
Erinaceus europaeus |
9365 |
En|Ch |
|
Et |
Echinops telfairi |
9371 |
En|Ch |
|
Fc |
Felis catus |
9371 |
En|Ch |
|
Ga |
Gasterosteus aculeatus |
69293 |
En|Ch |
|
Gg |
Gallus gallus |
9031 |
En|L|Ch |
|
Gm |
Glycine max |
3847 |
En|Ch |
|
Go |
Gorilla gorilla |
9593 |
En|L|Ch |
|
Hs |
Homo sapiens |
9606 |
En|L|Ch |
|
Hv |
Hordeum vulgare |
4513 |
En|Ch |
|
La |
Loxodonta africana |
9785 |
En|Ch |
|
Ma |
Macaca mulatta |
9544 |
En|L|Ch |
|
Md |
Monodelphis domestica |
13616 |
En|Ch |
|
Me |
Macropus eugenii |
9315 |
En|Ch |
|
Mi |
Microcebus murinus |
30608 |
En|L|Ch |
|
Ml |
Myotis lucifugus |
59463 |
En|Ch |
|
Mm |
Mus musculus |
10090 |
En|L|Ch |
|
Mx |
Mycobacterium tuberculosis |
1773 |
En|Ch |
|
Oa |
Ornithorhynchus anatinus |
9258 |
En|Ch |
|
Oc |
Oryctolagus cuniculus |
9986 |
En|Ch |
|
Og |
Otolemur garnettii |
30611 |
En|Ch |
|
Ol |
Oryzias latipes |
8090 |
En|Ch |
|
Op |
Ochotona princeps |
9978 |
En|Ch |
|
Os |
Oryza sativa |
4530 |
En|Ch |
|
Pa |
Pseudomonas aeruginosa |
287 |
En|Ch |
|
Pc |
Procavia capensis |
9813 |
En|Ch |
|
Pf |
Plasmodium falciparum |
5833 |
En|Ch |
|
Po |
Populus tremula |
113636 |
En|Ch |
|
Pp |
Pongo pygmaeus |
9600 |
En|Ch |
|
Pt |
Pan troglodytes |
9598 |
En|Ch |
|
Pv |
Pteropus vampyrus |
132908 |
En|Ch |
|
Rn |
Rattus norvegicus |
10116 |
En|L|Ch |
|
Sa |
Sorex araneus |
42254 |
En|Ch |
|
Sc |
Saccharomyces cerevisiae |
4932 |
En|Ch |
|
Sl |
Solanum lycopersicum |
4081 |
En|Ch |
|
Ss |
Sus scrofa |
9823 |
En|Ch |
|
Sp |
Schizosaccharomyces pombe |
284812 |
En|L|Ch |
|
St |
Spermophilus tridecemlineatus |
43179 |
En|Ch |
|
Su |
Staphylococcus aureus |
1280 |
En|Ch |
|
Ta |
Triticum aestivum |
4565 |
En|Ch |
|
Tb |
Tupaia belangeri |
37347 |
En|Ch |
|
Tg |
Taeniopygia guttata |
59729 |
En|Ch |
|
Tn |
Tetraodon nigroviridis |
99883 |
En|Ch |
|
Tr |
Takifugu rubripes |
31033 |
En|Ch |
|
Ts |
Tarsius syrichta |
9478 |
En|Ch |
|
Tt |
Tursiops truncatus |
9739 |
En|Ch |
|
Vp |
Vicugna pacos |
30538 |
En|Ch |
|
Vv |
Vitis vinifera |
29760 |
En|Ch |
|
Xl |
Xenopus laevis |
8355 |
En|Ch |
|
Xt |
Xenopus tropicalis |
8364 |
En|Ch |
|
Zm |
Zea mays |
4577 |
En|L|Ch |
Table 2. Default Supported Species. The available species for immediate analysis in GO-Elite are shown along with their corresponding two-letter species codes. These codes are used to designate the species data to analyze in the GO-Elite web interface. The column “compatible algorithms” indicates the compatible primary ID systems linked to ontologies, pathways and gene-sets. These include: En=Ensembl, L=EntrezGene and Ch=HMDB.
|
Figure 3. GO-Elite Web Interface. To use this interface users must first know or look up the two letter species code for their data (link=Species), locate the already created input and denominator files (containing ID and system codes), select the optimal primary system linking to your System Code (Ensembl in most cases). |
From the GO-Elite website (http://www.genmapp.org/go_elite), select the link under GO-Elite Web Services. This link will take you to a web page where you can select the species code corresponding to your species (e.g., Mm = Mus musculus and Hs = Homo sapiens), the location of the file containing your input and denominator gene lists and the analysis parameters used by GO-Elite. These parameters are discussed in the following section on Using the Stand-Alone Program Graphical User Interface. Once these options are selected, click “Submit” to start the analysis. A window displaying the job status will appear. Once finished, links to the results files will be provided. The results can be browsed from the file server and downloaded to your hard-drive (Section 3 - Interpreting GO-Elite Results).
Please note that the time of the analysis depends on the size of the input ID list and number of permutations selected. An input list of 4,000 gene IDs and 2,000 permutations can take up to 25 minutes, whereas a list of 500 genes and 0 permutations will take ~1 minute.
Running GO-Elite Locally Using the Graphical User Interface
When installed locally through the stand-alone application, GO-Elite has a simple, intuitive graphical user interface intended to be run by novices and experts alike. To run GO-Elite, follow the appropriate instructions.
· PC – Double click on the file “GO_Elite.exe”.
· Mac and Ubuntu – Double click on the file “GO_Elite”. If an OS specific version is unavailable, follow the source code instructions.
· Linux or source
code –
Installation of python is required, but is typically present with most Linux
installations and Mac OSX. To run, open a terminal window on Linux or Mac or
a DOS prompt on PCs and go to the GO-Elite main folder (e.g. cd GO-Elite_1.2.4).
Once in this directory typing “python GO_Elite.py” in the terminal window
will begin to run GO-Elite (you will see the below interface screen). For
command line options, please read the instructions at the end of this
section.
Main Options
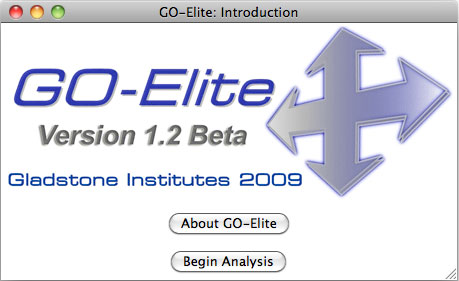
When GO-Elite is launched, the user is presented with an introduction screen, where they can get version information or begin the analysis. After selecting “Begin Analysis” the user is presented with four options:
1) Analyze ID Lists
2) Prune Existing Results
3) View Data on Pathways
4) Update or Add Databases/Pathways
|
A |
B |
|
|
|
|
Figure 4. GO-Elite Introductory Windows. A) GO-Elite information screen and B) Main analysis and update options. |
|
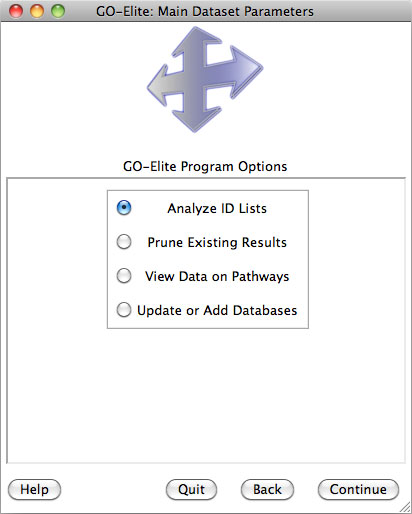
Selecting Analyze ID Lists is used when starting with an input and denominator ID list, whereas Prune Existing Results is only necessary when starting with existing Gene Ontology (GO) or pathway results, which can include previously produced GO-Elite outputs. Selecting View Data on Pathways can be used to import, color and export pathway images from WikiPathways web-service. Selecting Update or Add Databases is selected if you want to add currently unsupported species gene relationships or update existing relationships (Figure 4). More on this option is available in Section 5.
Downloading Species Gene Databases
When beginning any analysis for the first time, the user will be prompted to download a species database as well as Additional Resources (multiple Ontologies and Gene-Sets), after selecting either Analyze ID Lists or Prune Existing Results. Over 60 species gene databases are supported by GO-Elite corresponding to over 50 gene ID systems. Gene databases are built from either exclusively from the Ensembl, HMDB and WikiPathways databases or are further augmented from Affymetrix and NCBI EntrezGene annotation files (EnsMart versus EnsMartPlus).
|
Figure 5. Official Species Database Options. Selection options for Ensembl centric species database downloads, additional resources and Gene Ontology structure data. |
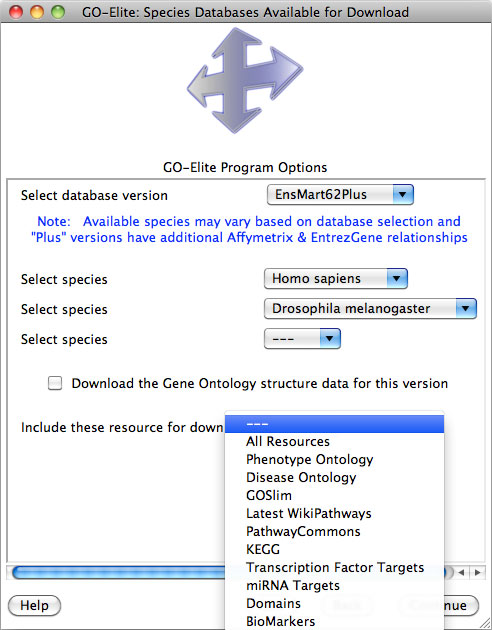
When prompted to select a species, find the species and genus name of the organism to be analyzed under the drop-down menu along with the corresponding version of Ensembl. Some species databases will only be available for specific Ensembl versions and augmented databases (Figure 5). Exclusively built Ensembl databases have the name "EnsMart" followed by the Ensembl version number, while augmented databases have the suffix "Plus". In both database versions, metabolite support is included with the primary metabolite ID system HMDB. Most users will wish to download the "Plus" databases, which contain richer gene annotations for Affymetrix and EntrezGene, however, users of GenMAPP and PathVisio may wish to download the Ensembl exclusive versions, since these match the database content from those programs without additional augmentation.
The option Download the Gene Ontology structure data for this version will download the version of the Gene Ontology hierarchy used to build the Ensembl specific version initial annotations and will over-ride any existing GO structure annotations.
A new an incredibly useful option is to include additional resources (see Section 5),, such as Disease Ontology, PathwayCommons, Transcription Factor Targets when downloading your species database. Each resource will be downloaded from the source database ensuring the latest version is included. You can select either one resource or all resources from this drop-down menu. Select "Continue" to download the databases and proceed with analysis of your data.
This menu can be accessed again by selecting Update or Add Databases from the previous menu. If you wish to manually update any of the supported relationships or if your species or gene system of interest is not supported, see section 5 for updating/adding these.
Analyze ID Lists
When selecting the analysis option Analyze ID Lists, the user will be presented with a series of options for performing an over-representation analysis (ORA) on your ID lists. All options have pre-defined default parameters (defined in Config/options.txt).
|
|
|
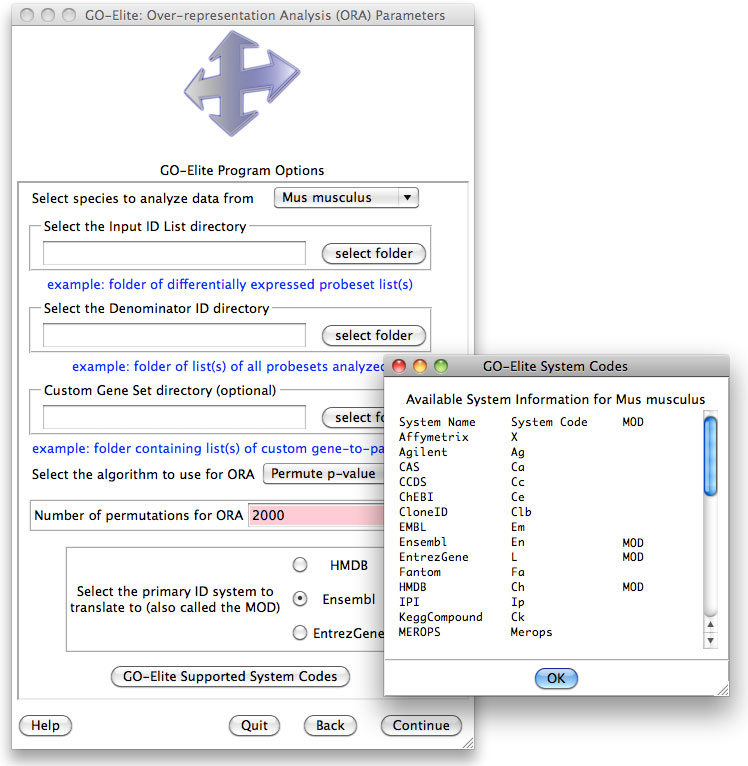
Figure 6. Over-Representation Analysis Options. Selections options for database version, species, input and denominator file directories, permutation statistics, primary gene system and optional custom gene sets to add. |
This
analysis computes an over-representation Z score and permutation p-value for
each Ontology-term, pathway or gene-set (Figure 6). The options for this menu
are:
1) Selecting species to analyze data from: Tells GO-Elite what species your ID lists correspond to.
2) Select the Input ID List directory: Tells GO-Elite where your input ID list(s) are located. Multiple input files can be placed in this directory. From the selected menu, double-click on the folder with the input ID files.
3) Select the Denominator ID List directory: Tells GO-Elite where your denominator ID list(s) are located.
4) Custom Gene Set directory: (optional) Directory containing custom lists of genes and pathways (tab-delimited two columns (.txt)), XML formatted pathways (WikiPathways (.gmpl), BioPax (.owl)) or Broad MSigDB gene sets (.gmt). When selected, these will be used for pathway (local) over-representation analysis as opposed to the default WikiPathways. The IDs in these files will be converted to the primary ID system selected (e.g., Ensembl), where possible. Note: Some databases with BioPax entries may not be compatible due to differences in the content format.
5) Select the number of permutations for ORA: Indicates the number of permutations to run for ORA. With increased permutations, you have more statistical confidence but also much longer run-times. The default value of 2000 is recommended for most analyses, but 0 is also acceptable.
6) Select the primary ID relational database: This option tells GO-Elite which ID system to use when linking data to Ontology terms and pathways. If IDs from Ensembl, EntrezGene or HMDB are used in the input files, simply select the appropriate ID system, but if you are working with other gene IDs (such as Affymetrix), then you typically can choose between either Ensembl or EntrezGene. When working with other chemical ID systems, such as PubChem, CAS, ChEBI, or KeggCompound, then select HMDB. The built-in association databases will translate between ID systems.
Once these options are established, GO-Elite will prompt the user on which filtering statistics to apply to the computed ORA results (see following section).
Pruning ORA Results
In this window the user sets the options for filtering and pruning ORA results from GO-Elite or other software with this formatted output (Figure 7). Pruning is the process of intelligently examining the hierarchical structure of an Ontology, such as GO, and comparing the ORA scores of enriched terms based on their relationships to each other. Highly related terms highlighted by ORA are considered to be redundant with each other, hence, pruning is used to select the highest scoring term among a set of related terms, while retaining any distinct related terms (see Section 4 - Algorithms). All Ontologies analyzed will be both filtered an pruned. These options include:
|
|
|
Figure 7. Pruning and filtering options following ORA. Three options for pruning Ontology terms are provided. |
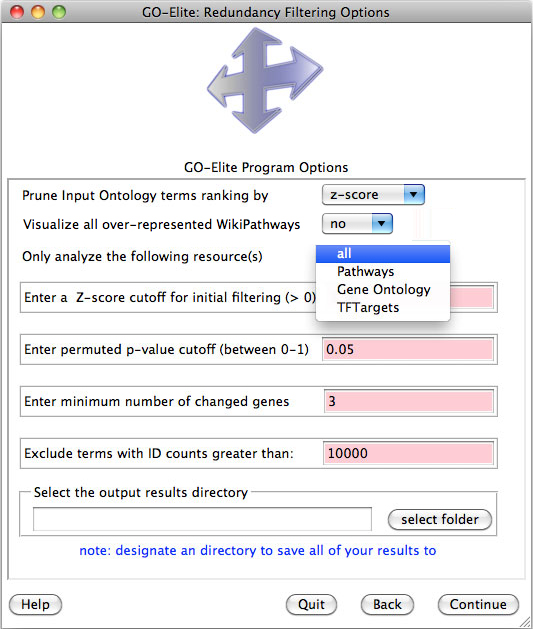
1) Pruning input Ontology terms ranking by: This option instructs GO-Elite which pruning option to use on the output ORA data (this is the Elite step). The options are “Z score”, “gene number” and “combination”. These comparison statistics are used to compare related Ontology terms that have a minimum Z score, maximum permuted p-value and minimum number of genes designated by the user in the below entry fields. Only those Ontology-terms or pathways that meet these filters are used for filtering in GO-Elite. The Z score option will instruct the program to compare related Ontology terms based on their relative over-representation Z score, which is an indicator of degree of over-representation. Gene number compares the number of genes/metabolites changed in the pathway/Ontology-term. Combination uses the Z score times the log2 number of genes changed to rank related Ontology-terms. When two or more related Ontology-terms are compared, GO-Elite chooses the Ontology-term with the highest scoring statistic based on the relative position of the terms in the Ontology hierarchy. The user is encouraged to try different methods and compare the results.
2) Select the output results directory: Selecting this button opens a folder selection menu, where the user can choose which directory to save your GO-Elite pruned results to. The results will be stored in a new sub-directory of this folder named “GO-Elite_results”. If using the Analyze ID Lists option, the user’s ORA results will also be saved to this folder in the directory named “GO-Elite_results/CompleteResults/ORA”. You will notice the result files will be saved to a sub-directory of “ORA”, named “archived-*time-stamp*” where the time-stamp indicates the date and time the analysis was run. If the user selected Prune Existing Results, this directory is the one containing your previously generated ORA file(s).
3) Select the Input ID List directory: This option is only present if Prune Existing Results was selected. It allows the user to locate the directory containing a set of input gene lists that corresponds to the ORA results file. The array IDs/genes in this file will be linked to the results file and used to annotate the results based on which actual genes are changed. The name of the input files should be Identical to the ORA results file, where the ORA results may also be preceded by “-GO.txt” or “-local.txt”.
4) Restrict analysis to WikiPathways or Gene Ontology terms. Provides the option to only look at either WikiPathways or Gene Ontology terms. This option is used to perform focused, quick analyses.
5) Exclude terms with genes counts greater than 10000. When filtering, remove uninformative terms that capture top-level Ontology terms.
5) Visualize all over-represented WikiPathways. When analysis of WikiPathways is supported for that species, selecting yes for this option will have GO-Elite produce colored image files of those WikiPathways considered “significant” with the log2 values present in the 3rd column of the analyzed input file. These values must be present for this analysis to build the proper visualization files. Typically, each pathway takes 30 seconds to a minute to create. When this function is run from the source code version of GO-Elite, the python library Suds must first be installed (see example output in Fig.10 and additional details below).
Calculating Results
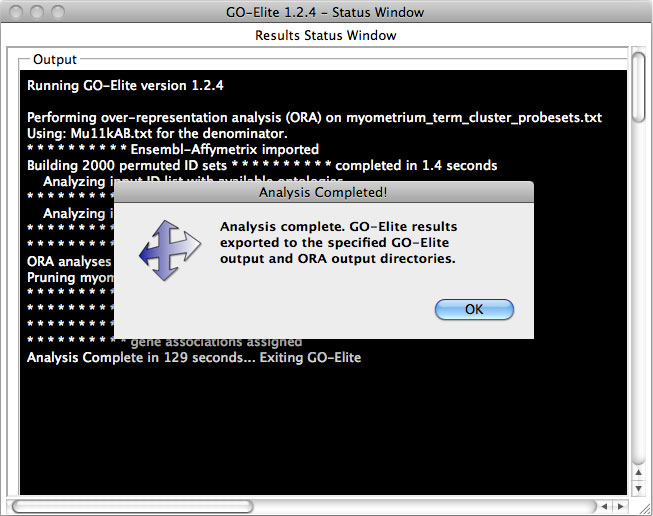
Once the filtering options are selected GO-Elite will present a status window displaying the results of the analysis (Figure 8). Processing can take several minutes to 45 minutes per input ID list, depending on the size of the input ID list and the number of permutations.
|
|
|
Figure 8. Run status window. Print outs of the status of all analyses. |
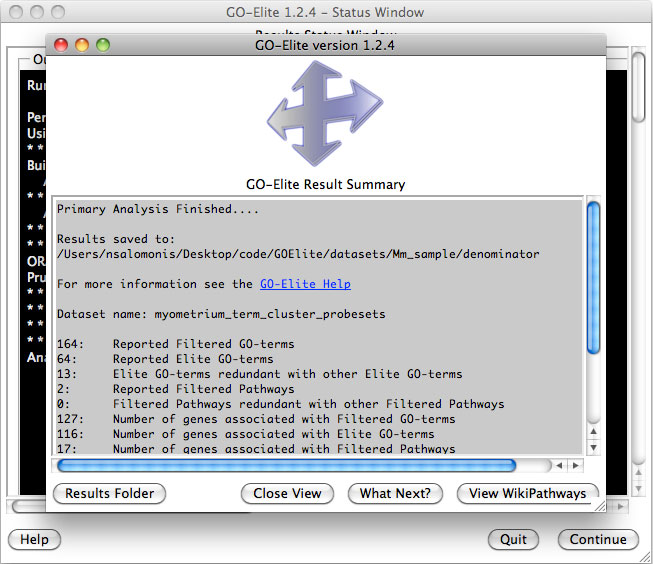
Once finished, the number of GO terms and WikiPathways (default) matching the user filters will be displayed along with the corresponding number of unique IDs (for the selected gene system) (Figure 9). This information is exported to the file "GO-Elite_report.log" in the user output directory. Selecting the option Results Folder will open the output folder designated by the user. Additional options are present in this window providing link-outs to more information.
|
|
|
Figure 9. Results summary. Print outs of the number of filtered and pruned Gene Ontology and WikiPathways results and gene associations for each. |
Visualizing Genes and Metabolite Changes on Pathways
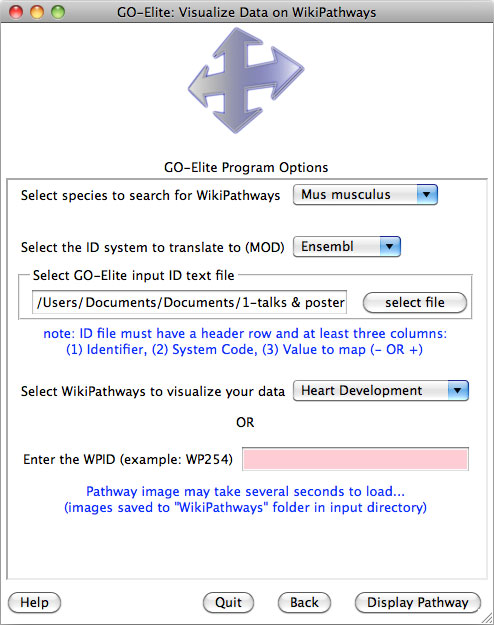
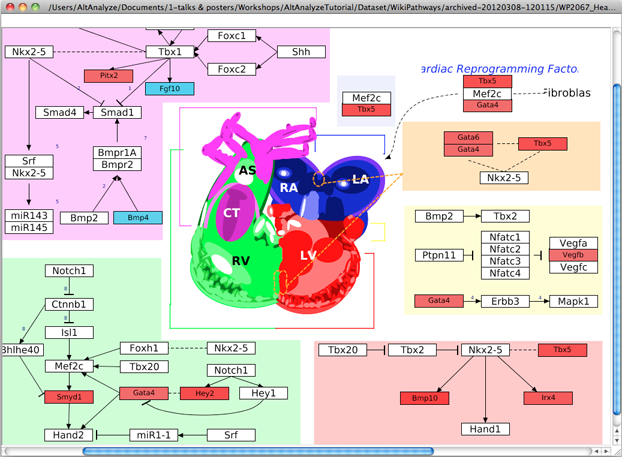
In addition to GenMAPP-CS, users can view quantitative gene or metabolite changes on pathways collected at WikiPathways. This useful option allows the user to select any given public WikiPathway and view the most recent version with any range values from their data. The WikiPathway visualized is the very most recent version stored online through the WikiPathways webservice, allowing users to immediately update pathways and see corresponding changes (Figure 10). Data is visualized from a user provided identifiers supplied in a standard GO-Elite input file (must contain a system code and fold changes). Default colors are blue for negative folds and red for positive folds as a gradient (log 2 fold changes recommended). A PNG and PDF version of the pathway are saved to the folder “WikiPathways” in the folder containing the GO-Elite input file. For more advanced custom visualizations and back-page support for pathway IDs, we recommend using GenMAPP-CS.
|
|
|
|
Figure 10. Visualize WikiPathways in GO-Elite. After or before completing the ORA, users can select pathways to visualize their data upon at WikiPathways. The top panel is the selection window opened from the Main Menu and the bottom panel is an example view. Default red = positive values, blue = negative values. |
Running GO-Elite Locally Using the Command-Line Option
GO-Elite can also be executed using the command line in a terminal or DOS prompt window. To do this, follow the below steps:
- Download and extract the source-code version of GO-Elite
- Open a terminal or DOS prompt window
- In the terminal, change directories to the GO-Elite application folder
- Input the command line options.
After extracting the GO-Elite zip archive, download species databases for analysis:
python GO_Elite.py --update Official --species Mm --version EnsMart62Plus --additional all
Compatible database version can be obtained by going to http://www.genmapp.org/go_elite/Databases/.
Once the database is installed, create a statement to analyze gene/metabolite
lists. For example, on a PC, given a directory of input and denominator text
files:
python GO_Elite.py --species Mm --mod Ensembl --permutations 2000 --method "Z score" --zscore 1.96 --pval 0.05 --num 3 --input "C:/Mm_sample/input_list_small" --denom "C:/Mm_sample/denominator" --dataToAnalyze all --output "C:/Mm_sample"
These flags instruct GO-Elite to analyze an input
and a denominator list using specified statistical parameters (see below).
Note that in this example the 2nd through 8th option
represent default values, and as such they can be omitted. Thus, an
alternative to the example above would be:
python GO_Elite.py --species Mm --input "C:/Mm_sample/input_list_small" --denom "C:/Mm_sample/denominator" --output "C:/Mm_sample"
To have GO-Elite create colored WikiPathway image files (PNG and/or PDF) you can add additional tags to the GO-Elite run command:
python GO_Elite.py --species Mm --input "C:/Mm_sample/input_list_small" --denom "C:/Mm_sample/denominator" --output "C:/Mm_sample" --returnPathways all --imageType pdf
As illustrated, options are presented as flags, preceded by "--". Flags for analysis functions in GO-Elite are:
--species string Two
letter species code corresponding to the genus and species recognized by
GO-Elite (see GO-Elite application folder/Config/species.txt). Examples are
"Hs" (human), "Rn" (rat), "Bt" (Bos taurus).
--mod string Primary
gene system linked to Gene Ontology (GO) or pathways used by GO-Elite.
By default this is Ensembl. The other options are "EntrezGene" and
“HMDB”.
--permutations integerNumber of permutations performed for over-representation analysis (ORA). To
calculate a Fisher’s Exact Test p-value, enter “FisherExactTest” instead of a
number for permutations.
--method string Pruning
Method used by GO-Elite ("Z score", "gene number",
combination).
--zscore float Remove ontologies
or pathways reported from the ORA with a Z score less than this threshold.
--pval float Remove ontologies
or pathways reported from the ORA with a permutation or Fisher Exact Test
p-value (non-adjusted) greater than this threshold.
--num float
Remove ontologies or pathways reported from the ORA with the number of
genes changed less than this threshold.
--input string Full
hard-drive path of the folder containing the text file(s) (list of gene IDs
and system code for ORA - e.g., Affymetrix).
--denom string Full hard-drive path of the folder
containing the denominator text file(s) for input list.
--customSet string Full
hard-drive path of the folder containing additional pathway-level
associations (.txt, .gpml, .owl, .gmt).
--dataToAnalyze string Indicates whether to analyze only “Pathways”, “Gene Ontology” or “all”.
--output string Full hard-drive path of the folder that GO-Elite will save the result folders and files to.
--returnPathways string When set equal to “yes” or “all”, will return all WikiPathways as colored PNG or PDF files (by default both) based on the input ID file data and over-representation results. Default value is “None”. When equal to “top5”, GO-Elite will only produce the top 5 (or other user entered number – e.g., top10) ranking WikiPathways.
--imageType string When set equal to “png” or “pdf”, will only return the selected file type as opposed to both. Only applicable when --returnPathways tag is included.
The result files produced by these command line options are identical to those produced by the graphical user interface. In addition to instructions for analyzing data in GO-Elite, the user can pass flags to visualize data on pathways, update specific database tables or add new species support. Most of these commands are intended for advanced users/developers wanting to build entire databases from scratch. Below are several examples:
-Visualize a GO-Elite input file on a WikiPathway (WPID):
python GO_Elite.py --input /users/test/input/criterion1.txt --image WikiPathways --mod Ensembl --species Hs --wpid WP536
-Download
and integrate the latest Gene Ontology OBO format files:
python GO_Elite.py --update Ontology --OBOurl http://www.geneontology.org/ontology/gene_ontology.obo
-Download
and integrate specific additional resources:
python GO_Elite.py --update AdditionalResources --species Mm --version EnsMart62Plus --additional BioMarkers --additional PathwayCommons --additional Domains
-Download
and integrate the most current EntrezGene-GO relationships:
python GO_Elite.py --update EntrezGene --species all
-Update
Affymetrix-EntrezGene, Affymetrix-Ensembl and EntrezGene and current
WikiPathways relationships. Affymetrix files must be in
BuildDBs/Affymetrix/*species-code*:
python GO_Elite.py --update Affymetrix --update WikiPathways --species all --uaffygo no --replaceDB yes
-Incorporate
the most recent WikiPathways relationships:
python GO_Elite.py --update WikiPathways --species all
-Add
new species information (not necessary when adding Ensembl support for a new
species):
python GO_Elite.py --addspecies yes --speciesfull “Ciona intestinalis” --species Ci --taxid 7719
-Re-build
a specific version of Ensembl for a selected species from scratch:
python GO_Elite.py --update Ensembl --species Dr --system EntrezGene --system UniGene --system “Uniprot/SPTREMBL” --system “AFFY_Zebrafish” --system “AGILENT_G2518A” --replaceDB yes --force no --version 56
-Simultaneously
update multiple relationships, ID systems and species:
python GO_Elite.py --update Ensembl --update metabolites --update Affymetrix --update WikiPathways --update EntrezGene --speciesfull all --system all --replaceDB no --delfiles yes --version EnsMart62
As demonstrated above, there are multiple options when downloading, importing, processing and exporting various gene relational databases. Some flags are specific to certain update options and will be ignored if used in the wrong situation (e.g., --uaffygo and --version). Flags for update functions in GO-Elite are:
--image string With the
argument “WikiPathways”, this flag directs GO-Elite to visualize user input
on pathways using the WikiPathways API. This command also requires that a
WikiPathways ID is included, along with species and mod names.
--wpid string Passes the
WikiPathway ID number corresponding to a specific WikiPathway. This can
include public WikiPathway. This ID number is at the end of any WikiPathways
URL.
--update string This flag
directs GO-Elite to update the user provided system relationships. No default
arguments for this flag. Arguments for this flag are “Ensembl”, “EntrezGene”,
“metabolites”, “Ontology”, “Affymetrix”, “AdditionalResources” and “WikiPathways”. When
choosing the update option “Affymetrix”, the Affymetrix CSV files must be
saved in the appropriate species folders in the directory “BuildDBs/Affymetrix”
prior to update. When the option “Ontology” is accompanied by the flag --OBOurl <url here>,
the Gene Ontology OBO file will be replaced with the new OBO file designated
in the URL (e.g., phenotype Ontology) and automatically used during the next
analysis (must be accompanied by addition of appropriate Ontology gene
associations). Selection of “GeneSets” will update all supplemental Ontology,
pathway and GeneSet files (Section 5).
--additional string Default value is None. When the value is set to one of a valid resource or “all”, GO-Elite will download and incorporate that resource along with the default downloaded (WikiPathways and Gene Ontology). Additional resources currently include the options: “miRNA Targets”, ”GOSlim”, ”Disease Ontology”, ”Phenotype Ontology”, ”KEGG”, “Latest WikiPathways”, ”PathwayCommons”, ”Transcription Factor Targets”, ”Domains” and ”BioMarkers” (include quotes).
--OBOurl string Default
value is an empty string. When the value is set to a url for an OBO format
Ontology file, this file will be downloaded to the directory “OBO” and any
existing Ontology files in that directory will be moved to the folder
OBO/archive. When any analysis is started, GO-Elite will use this Ontology
file to build its default ontology annotations. Hence, any new Ontology
(other than GO) added will require the user to update or replace the
Ensembl-GO, EntrezGene-GO or custom-GO relationship file. Only in the case of
GO-Slim is this not required, as the GO-Slim associations from Ensembl will
automatically replace the original GO associations when a GO-Slim OBO file is
imported.
--force string Default
value is “yes”. With the argument “yes”, this flag directs GO-Elite to download
the latest version of the database. If “no” is indicated, GO-Elite will use
any previously downloaded build files. If no build files are present and “no”
is chosen then GO-Elite will set force equal to “yes”.
--replaceDB string Default
value is “no”. With the argument “yes”, this flag directs GO-Elite to replace
rather than update the existing relationship table. Note: If downloading
multiple tables of the same system, such as Affymetrix array platforms, if
this option is set to no, then only the first Affymetrix table will be
over-written by the other.
--version string/integer Indicates
the version of Ensembl to download. Default value is “current” (most recent
version). Other valid version arguments are numeric (greater than 46 and less
than the current version number).
--system string Corresponds
to the name of the gene system related to Ensembl to be exported. For
example, the argument “EMBL” will direct GO-Elite to export an Ensembl-EMBL
relationship file for use in GO-Elite. These tables are saved to the
“uid-gene” folder for that species and are considered secondary gene systems
that relate to the primary. As such, the user can construct the input and
denominator lists with these secondary system IDs (e.g., EMBL) for GO-Elite
analysis. Multiple systems can be designated in a single command line
operation. The argument “all” is used to export all related systems whereas
the argument “arrays” will export all array systems (e.g., Affymetrix,
Illumina, Agilent). See the file “Config/ EnsExternalDBs.txt” for a list of
compatible systems. After a run, additional external DBs will be provided in
“Config/external_db.txt” and “Config/array.txt”.
--speciesfull string Alternative
to the flag --species, required when the Ensembl species to update is not
currently in the database. Rather than the species code (e.g., Ci), the
argument for this flag is the full species name (e.g., “Ciona intestinalis”).
If the argument “all” is provided, all supported species in Ensembl will be
used. Quotations around the species name is required.
--uaffygo string Default
value is “no”. When the argument equals “yes”, GO-Elite will also extract the
Ensembl-GO and EntrezGene-GO relationships from the Affymetrix CSV file(s).
--addspecies string Default
value is “no”. When the argument equals “yes”, GO-Elite will add new species
information to the database. Required flags for this option are --speciesfull, --species and --taxid.
--taxid integer Taxonomy
ID from NCBI (http://www.ncbi.nlm.nih.gov/Taxonomy/).
--delfiles string Default
value is “no”. When the argument equals “yes”, GO-Elite will delete any
downloaded files used to extract out Ensembl or EntrezGene-GO relationships.
These files can take up substantial hard-disk space (up-to 3GB for Ensembl,
depending on the species), and are not required after data extraction is
complete.
--buildNested string Default
value is “no”. When the argument equals “yes”, GO-Elite will rebuild the
nested gene-GO associations needed for Ontology-level analyses. Only needed
if these files are accidently over-written.
Note: All database update functions are available in command-line mode accept for “Manually Add New Relationships” functions, which are only supported in the GUI.
Known Issues and Requirements Running GO-Elite
Be aware that certain issues exist which may affect the user analysis. These include:
1) Only one ID system can be analyzed at a time - If multiple system codes are present in the second column of an input or denominator file, GO-Elite will inform the user and exit the analysis.
2) A denominator file must always be provided – This important to properly estimate the background distribution of IDs (e.g., genes or metabolites) evaluated in a given experiment.
3) Segmentation fault error on Mac OS X – When running GO-Elite, if the user switches back and forth to another application, GO-Elite can crash. This is caused by an apparent issue with Python’s interface to Tcl and Tk.
4) Input text formatting errors – While we have tried to account for different text file formatting differences, problems may occur with certain text file formats, non-standard characters extra spaces. If you receive a formatting error, please try to reformat your text file (e.g., copy and past special in Excel).
5) Missing headers – If headers rows are missing in the input or denominator file, errors can persist. This first row is ignored by the program.
6) Limited ability to guess ID systems – When a system code is missing from the input or denominator file, GO-Elite will try to guess the ID system. This works well for old Affymetrix IDs, most Ensembl species and some UniProt IDs, but is limited. We recommend you supply a system code for optimal performance.
7) Temporary failure to connect to online resources – GO-Elite can update various resources automatically from online FTP and HTTP servers. If these servers are down or have limited access, GO-Elite will be unable to retrieve the requested data. Please try again later if this occurs or contact us if a resource seems to no longer be accessible.
Section 3: Interpreting GO-Elite Results
GO-Elite Output Files
Six primary file types are exported by GO-Elite with the completion of each run. These include:
1) Over-representation analysis (ORA) results (aka ORA)
2) Pruned ORA results (aka ORA_pruned)
3) Gene annotation file
4) Gene ranking file
5) Input gene-pathway associations file
6) Comparison of Ontology/Pathway terms
Each one of these files is created for each input user gene or metabolite list Ontology (e.g., GO) and local (e.g., WikiPathways) results. Since many files can be created when a user is analyzing multiple gene lists, an additional combined file is created for files 2, 3, and 4, which will contain all criterion analyzed in a single run, including Ontology and pathway results together.
These combined files begin with the name “pruned-results”. Most users will just want to get these combined results. See the folder GO-Elite_results.
ORA Results
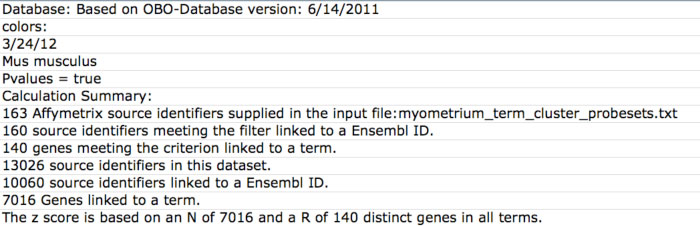
These files are similar to those produced by the program MAPPFinder 2.0, a component of the application GenMAPP version 2 (Figure 11). For each GO-Elite analysis, ontology and GeneSet ORA results file are created and saved to the folder “CompleteResults/ORA”, in a sub-folder with the appropriate time stamp (e.g., “archived-20091203-162240”). These files have the same name as the input gene list with the addition of the suffix “-GO.txt” or “-local.txt” for GeneOntology and WikiPathways, respectively. Information on the date of the OBO files used, number of IDs in the user input file, number of genes linked to ontologies or pathways, and input file name are reported at the top of this file.
|
|
|
Figure 11. ORA output file statistics for GO. Summary statistics on the number of input source IDs (e.g., Affymetrix probesets) and associated primary gene identifiers. |
The
main contents of this file are Ontology or GeneSet names, IDs, number of
genes changed, number of genes associated with each term, Z scores,
permutation p-values, and Benjamini-Hochberg adjusted [3]
p-values (Figure 2). There are also a number of blank columns. These would
typically contain non-nested Ontology gene associations, which are not
currently calculated in GO-Elite. This
file same format is similar to the program MAPPFinder which produced similar
results for ORA.
These files list Ontology, GeneSet and WikiPathways pathways (local) gene associations to genes from your input and denominator files along with calculated statistics for ORA (Z score, permutation p-value and Benjamini-Hochberg false discovery rate p-values). To determine which pathways might be of most interest, open either of these files in MS-Excel. Select the row containing the column headers (e.g., row 18 for the local file) and then select the menu item “Data”, “Filter”, and “Autofilter”. A series of dropdown menus appear above each field in this row. We recommend filtering based on the “Number Changed” (>2), “Z Score”(>1.96), and “PermuteP”(<0.05). Performing this filter or other user defined filters will reduce the set of results from hundreds to a handful of pathways that are over-represented in your analysis.
|
|
|
Figure 12. Ranked ORA GO Results. Ranked results in the ORA output. |
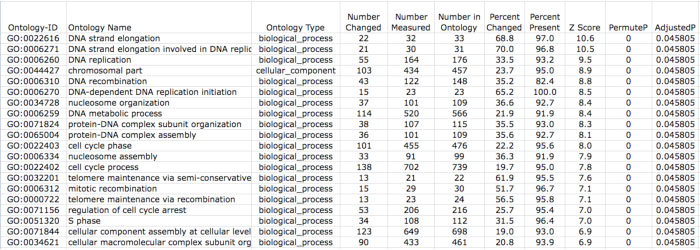
In these result files, you will likely have many terms that are related to each other and thus have largely redundant gene content. For example, “DNA strand elongation”, “DNA strand elongation involved in DNA replication”, and “DNA-dependent DNA replication initiation” are all top regulated terms in this results file (Figure 12). Thus, these files are further pruned by GO-Elite to report a minimally redundant set of ORA terms.
Pruned GO-Elite ORA Summary Results
The pruned ORA files are similar to that of the MAPPFinder output except in that the reported terms are pruned to only include non-redundant information. These files can be opened in Microsoft Excel or similar spreadsheet program and include a summary of the gene symbols for any changed genes and the mean of any numeric data in the input gene list file. The files are saved to the folder “GO-Elite_results” with the named “pruned-results” and to “CompleteResults/ORA_pruned” with the same name as the original input gene ID file with the suffix pruning algorithm + “_elite.txt”.
Pathway Gene Association Files
These files contain all GO and pathway terms listed in the pruned ORA summary result’s file along with associated input gene IDs and gene annotation information. These files are saved in the folder “GO-Elite_results” to “pruned-gene-associations.txt “ and to the folder “CompleteResults/ORA_pruned/gene_associations” with the suffix “-gene-associations.txt”. Each line in this file consists of a gene name, symbol, primary ID, source IDs, GO term or pathway and associated user-data in the input file.
All Gene Association Files
These files are found in the ORA CompleteResults directory with the full pathway association files. These files contain the primary gene ID to pathway associations for input IDs. Gene or metabolite symbols will be listed along with each ID.
Gene Ranking Files
These files contain all genes listed in the GO-Elite gene-association file, the number of pruned ORA summary terms associated with that gene, percentage of terms the gene is associated with, and associated terms are listed on each line. These files are also saved to the “gene_associations” file directory. These genes are listed in descending order, based on the number of terms each is associated with this. Unlike the gene-association files, each gene is only listed once. This file can be used determine which sets of genes may be over-represented among GO-Elite terms.
Combined Files
The combined files for pruned ORA results, gene association, and gene ranking files are stored into a single file for each of these three categories. These include all input gene lists analyzed in a single GO-Elite run, GO, and local pathway results. Each line is identical to that in the original input file, except in that the first column indicates the filename of the data it was derived from. These are typically the most useful files, since they contain all of the data combined into a single spreadsheet.
Comparison of Ontology/Pathway/GeneSet terms
When multiple input ID lists are provided to GO-Elite in the user input directory, a comparison of all GO-Elite terms presented in the pruned summary results will be saved to the file “overlapping-results_Z score_elite.txt'. This file contains all Ontology terms and pathways reported in the pruned results file along with basic summary statistics for all input ID lists. This file is particularly useful when trying to identify which pathways display enrichment in one dataset, but not another.
Downstream Analyses and Visualization
As you’ve seen, GO-Elite is a useful tool to summarize gene and metabolite-level
changes from high-throughput experiments at the level of pathways and ontologies.
In addition to these options, if the user includes quantitative values
directly in their input file, these will also be summarized at the level of Ontology
terms and pathways. This analysis can be useful if your input file contains
data for multiple time-points or conditions and contains more than one
predicted expression pattern.
Expression Summarization of Pathways
If your input gene file contains numeric data from your experiment, this will
also be summarized in the GO-Elite output files. For example, if there are
fold changes for each probeset in the input file, all fold changes for
probesets associated with genes in a particular pathway will be averaged for
that pathway, likewise for ontology terms.
If the input file contains such data, the “pruned-results” file, will contain similar fold changes to those found in the input gene list, but summarized for each gene (where there are multiple probesets associating) and each pathway. These expression results can be graphed in a graphing program or clustered in an expression clustering and visualization program like Cluster and TreeViewer. In the example in Figure 13, the relative average expression patterns for each pathway can be compared, for example, the NetPath pathways Alpha6-Beta4-Integrin and EGFR1 appear to demonstrate selectively upregulated at 18 days of gestation (prior to labor), suggesting a role for this process in the onset of labor.
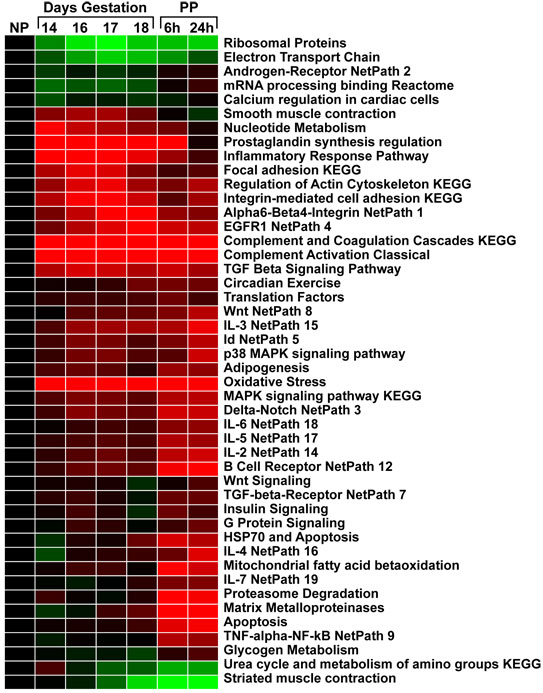
Figure 13. Clustering of GO-Elite Pathway-Level Summarized Data. Analysis of microarray data from a mouse uterine gestational time-course. GO-Elite was used to summarize all differentially regulated genes (ANOVA adjusted p<0.05) present in the input file along with log fold changes for each time-point relative to non-pregnant animals. Red indicates average upregulation for each GO-Elite filtered pathway and green indicates downregulation.
Simple Interaction Networks
Along with each GO-Elite result for an input ID list and corresponding
analyzed resource (e.g., WikiPathways, GO), a simple-interaction format (SIF)
file is saved to the directory “GO-Elite_results/CompleteResults/ORA_pruned”
listing all pruned pathway and ontology results. This format allows for fast
and immediate visualization of genes and metabolites associated with distinct
or common regulated terms in programs such as Cytoscape or iGraph (Figure
14).
|
|
|
Figure 14. Interaction of IDs and Terms. Visualization in Cytoscape of six GO-Elite over-represented terms and associated genes from the pruned SIF results (node rim and center color indicate distinct attributes). |
Section 4: Algorithms
GO and Pathway Over-Representation Analysis
A
Z score and permutation or Fisher’s Exact Test p-value are calculated to
assess over-representation of Ontology terms, gene-sets and pathways (local).
Z Score Statistics
This Z score is a normal approximation to the hypergeometric distribution. The Z score statistic is the primary rank statistic used to compare related over-represented ontology terms during pruning. To calculate the Z score, the observed number IDs (e.g., genes) in the input file is subtracted from the expected number of IDs associated with a particular biological and divided by the standard deviation of the observed number.
![]()
This statistic is expressed as:
n = Total IDs associated with a biological term (denominator list)
r = Input IDs associated with a biological term (input list)
N = Denominator IDs examined (denominator list)
R = Total Input IDs (input list)
Fisher’s Exact Test
A Fisher’s Exact Test two-side probability is calculated using a 2x2 contingency table. This table consists of: A) the number input IDs within a biological term (r), B) number of non-input IDs in a biological term (n-r), C) number of input IDs excluded from that term (R) and D) the number of non-input IDs excluded from that term (N-R-n-r). The Z score and Fisher’s Exact Test are both parametric statistics that make underlying assumptions about the distribution of identifiers within an ontology or collection of pathways. Among the potential problems with the assumptions made by these statistics are the inherent multiple testing of the same genes or metabolite present in distinct or related term. To account for these issues, we provide the option of using a non-parametric statistic based on a user-determined number of permutations of the data.
|
|
|
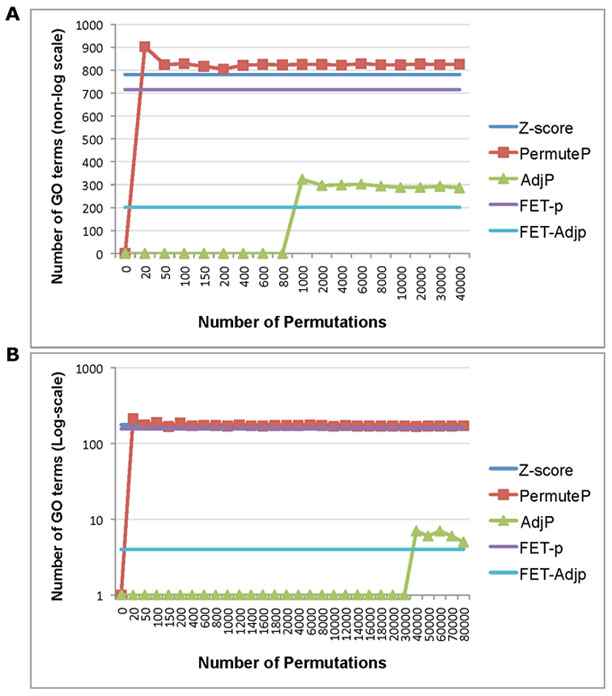
Figure 15. Comparison of ORA Test Statistics. The different test GO-Elite ORA statistic options are shown for two example input lists. (A) Number of GO terms associated with ~1100 regulated genes (human stem cell differentiation) with increasing number of permutations. (B) Number of GO terms (log-scale) associated with 140 regulated genes (mouse uterine muscle with gestation) with a larger range of permutations. Listed GO terms were required to have at least 3 genes in the input ID list. FET = Fisher’s Exact Test, PermuteP=permutation p-value, AdjP=adjusted p-value. |
Permutation and Adjusted P-values
The permutation analysis is performed to determine the likelihood of observing the calculated Z scores by chance. This is done by randomly selecting the same number of source IDs from the input file from all source IDs in the denominator file (all examined), translating these to a primary ID system (e.g., Ensembl, HMDB) and recalculating Z scores for all terms 2000 times (or user defined). The likelihood of a Z score occurring by chance is calculated as the number of times a permutation Z score is greater than or equal to the original Z score divided by 2000. An important caveat to this approach is that the precision of this statistic and corresponding adjusted statistic (see below) is dependent on the number of permutations performed. This consideration is most relevant for the adjusted p-value. While 2000 permutations is adequate to achieve a reasonably discriminating permute p-value, 2000 permutations may not be sufficient to achieve a sufficiently sensitive adjusted p-values when the number of associated genes and reported Ontology terms is smaller (1-200 terms Z-score enriched terms). This is illustrated for two examples in Figure 15, where a relatively small number of permutations (>=1000) is sufficient to obtain stable permutation-based p-values (and adjusted for panel A), but is not sufficient to obtain a stable adjusted p-value (panel B).
A false-discovery rate (FDR aka adjusted) p-value is calculated from the Fisher Exact Test or permutation p-value based on the Benjamini-Hochberg (BH) correction [3]. As noted above, permutations of >= 10,000 may be required for some analyses to achieve a reasonably accurate FDR p-values but result in significantly longer run-times. When the non-adjusted permutation p-value is zero (no permute Z scores >= observed), the adjusted p-value will automatically be equal to the smallest non-zero adjusted p-value.
Multiple Identifier Mapping for ORA
Some ID systems, such as Affymetrix probesets can have a single source ID that maps to multiple gene IDs (e.g., Ensembl) or multiple source IDs that maps to a single gene. One of the main functions of GO-Elite's ORA function is to not count a primary ID, such as probeset, more than once in to a GO-term or pathway. This philosophy minimizes falsely over-weighted results.
Below is the schema that GO-Elite's ORA function uses to build unique primary ID and gene to GO/pathway associations. These methods are largely similar to the program MAPPFinder 2.0's (a component of GenMAPP version 2), implementation. The below schema is illustrated for Affymetrix probesets.
1) Import all probesets in the criterion (input file in GenesToQuery directory) and denominator file.
2) Link the probesets to gene IDs (e.g. Ensembl) via the 'Ensembl-Affymetrix.txt' file in the 'uid-gene' Database species directory.
3) Import the gene to ontology relationships (e.g. 'Ensembl_to_Nested-GO.txt').
4) Send the denominator gene-probeset relationships (where the gene is the unique ID or key) and gene-nested ontology relationships to the mappfinder.py function 'countGenesInPathway'. For each gene in the gene-nested ontology table, store the unique set of probsets corresponding to the gene ID for that gene with that ontology term. Repeat the same process with just those IDs found in the input criterion file. This should produce the following theoretical results: If gene 1 maps to Probe X and Probe Y, store 'ontology_count_db[ontology_term] = [Probe X, Probe Y]'.
5)
For
each ontology term examined determine the number of unique sets of probesets
linked to genes (rather than count unique gene IDs count unique probeset
lists). Also store this probeset list ([Probe X, Probe Y]) for each gene as
the key in another database to find how many unique sets of probesets there
are corresponding to genes (unique gene count linked to the ontology).
Scenario 1
If you have the genes 1 and 2, that both match to probesets X and Y, the list of probesets X,Y will be counted once for each GO term and in the total number of genes linked to GO.
Scenario 2
If you have two genes, 1 and 2 and X associates with 1 and X & Y associate with 2, then two unique genes are counted.
For
scenario 1, if only probeset X is in your input list, then only one gene
is count (since X becomes the unique ID for both genes, and doesn't consider
Y). For scenario 2, although gene 2 links to X & Y, since only X is
present genes 1 and 2 are counted only once, since both ONLY link to X.
GenMAPP's
MAPPFinder implements a similar strategy (we've compared results but not the
Visual Basic code directly), but only for the criterion probeset-gene
relationships. For the denominator, it appears that the program counts the
number of unique Ensembl's linked to probesets, even if the associations are
redundant. Some people prefer the GenMAPP method, however, for GO-Elite we
decided to calculate the numerator and the denominator using the same method.
Filtering of ORA Results
The Fisher’s exact Z score, number of genes changed and non-adjusted permute p-value generated by ORA are the default statistics used for pruning ontology terms and pathways in GO-Elite. When performing a Fisher’s Exact Test analysis, this p-value will be used in lieu of the permute p-value. If ORA data from other GO and pathway analysis programs are used as input for GO-Elite filtering, analogous statistics are recommended. Upon import of ORA data, only those GO terms and pathways that meet the user defined minimum filters (by default, raw p-value < 0.05, Z score > 2 and number of genes change > 2) are processed for redundancy. Once imported, GO-Elite will compare related ontology terms based one of three possible options: 1) Z score, 2) number genes changed or 3) combination. The Z score option ranks GO terms only based on the calculated Z score, ranked from higher to lowest.
The gene number option allows the user to rank based on the number of genes changed in the ontology hierarchy, again from highest to lowest. The combination option is a weighted metric based on both number of genes changed and Z score, generated by multiplying the Z score times the log base 2 of the number of genes changed for a given ontology term. These scores are used for selecting which ontology terms will be reported by GO-Elite.
Pruning of Ontology Hierarchical Relationships
GO-Elite can process different types of ORA files, corresponding to either ontology results (file suffix “-GO.txt”) or pathway results (file suffix “-local.txt”). For GO-level results, after GO terms are initially filtered based on user defined statistics (permutep, number of genes changed and Z score), all possible parent-child relationships are built and stored for these ontology terms, where each parent is the key in the database (Python dictionary object) and all of its children are the value. This full database is stored for later queries while the full parent-child paths (agglomerated path relationships) for all entries are generated by iterating this process. The program then searches these relationships in a hierarchical nature to identify the ontology term that has a higher score than all of it’s children (along that branch of the tree) or sibling terms (children of a single parent, each representing distinct branches) where at least one of the sibling terms on a branch scores greater than the parent. For these sibling terms, if one sibling branch scores higher than the parent and another branch does not, the highest scoring term from the latter sibling branch is also selected for the GO-Elite output, but the parent term is not. A visual representation of this pruning strategy is shown for a theoretical set of parent-child relationships with corresponding Z scores (Figure 16).
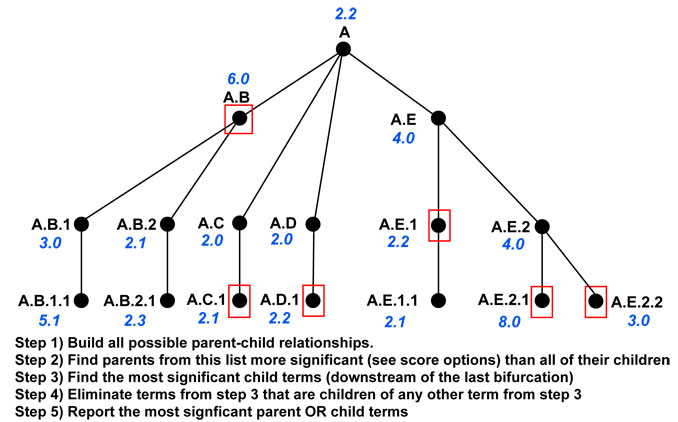
Figure
16. Example Ontology Z score pruning. Ontology
term relationships are shown according to their nested relationships along
with Z scores (blue). The black text indicates the nested relationship path
of each term in the ontology hierarchy. Red boxes indicate selected terms to
report based on Z score ranking.
This process allows the user to view the highest scoring term(s) for a particular branch of Ontology terms and eliminates redundancy of ontology terms within the same global category (e.g. biological process, molecular function and cellular component), without needing to consider associated gene content. Since some terms and branches are replicated within the ontology hierarchy (redundant), already eliminated or selected ontology terms are removed from the results from these other branches. A comparison of the output from the different pruning methods is provided at: http://code.google.com/p/go-elite/wiki/OntologyPruning.
Redundant Content Reporting
Each ontology and pathway output by GO-Elite undergoes a final step of redundancy analysis in addition to ontology pruning. This analysis examines the genes or metabolites associated with each biological term to determine which terms have redundant content. Redundancy can occur between two terms that are not directly related in the ontology share the same regulated genes. If term A contains genes found entirely within term B, in the summary reports from GO-Elite, term A list term B in the field “redundant with terms”. Likewise, term B will list term A in the field “inverse redundant”. The overlapping genes can be directly inspected by looking in the field “gene symbols” or by examining the corresponding “Gene-Ranking” file (GO-Elite_results/CompleteResults/ORA_pruned/gene_associations), which lists the terms associated with each ID.
Section 5: GO-Elite Gene and Pathway Databases
Database Files Overview
GO-Elite stores all of its gene, pathway and Ontology relationships locally as text files within the directory named “Databases” of the GO-Elite program folder. If the user downloads the “Official Database” releases, these files will be stored in a folder within the “Databases” directory with the name of the database version (e.g., “EnsMart62Plus). All databases can be easily updated, modified or replaced by the user within GO-Elite. In general there are three ways to update GO-Elite gene databases; 1) Download of the official GO-Elite databases, 2) selection of specific gene systems and relationships to update from files online and 3) addition or update of species tables from custom user tables. The following sections address how to perform these update functions for any database relationship. Note: most relationships needed to run GO-Elite for a species are already present in the pre-packaged species databases.
Downloading Official GO-Elite Databases
With each new version of the Ensembl database, two official GO-Elite databases are released. The first is exclusively built from the Ensembl database (e.g., EnsMart62) and the second contains additional relationships and species support from Affymetrix (EnsMart62Plus). Most users will wish to download the Plus database, which supports more species and more gene relationships. If a user wished to, they can fully recreate these databases in GO-Elite using the existing automated tools (see flowing sections).
In release 62 of the Ensembl database over 50 species are supported. The EnsMart62 database contains only gene relationships extracted from Ensembl, metabolite relationships from the human metabolome database (HMDB). The Ensembl annotations include all supported gene associations in the Ensembl database (e.g., Gene Ontology-to-Ensembl, Affymetrix-to-Ensembl, Agilent-to-Ensembl, RefSeq-to-Ensembl), whereas the HMDB annotations include all HMDB IDs to PubChem, CAS, ChEBI, and KeggCompound, and pathway IDs. An augmented version of this database (EnsMart62Plus) additionally has support for 14 other species, not found in Ensembl but for which there is support in Affymetrix annotation files. These augmented databases are built on top of the Ensembl specific versions, but also contain Affymetrix-to-EntrezGene and Affymetrix-to-Ensembl relationships from annotations provided by http://www.affymetrix.com as well as EntrezGene-to-Gene Ontology annotations from NCBI. These additional Affymetrix relationships can be useful, since EntrezGene often annotates organisms where Ensembl does not and Ensembl can exclude some valid probeset-gene relationships. However, since the non-augmented database contains the same content found in databases for the programs GenMAPP and PathVisio’s, users might want to restrict their analysis to the Ensembl only database. Both database versions contain gene to WikiPathways associations, obtained from the WikiPathways website. Introduced in GO-Elite version 1.24 is the option to include additional ontologies (e.g., Disease), pathways (e.g., KEGG) and gene sets (e.g., transcription factor targets) along with their ID associations (see “GO-Elite Distributed ORA Resources” below).
As outlined in Section 1, the Official databases can be downloaded when starting the program or by selecting “Download Species Databases” and select “Continue”. Once download is completed, GO-Elite will extract these annotations to the appropriate folders within the “Databases” directory. These relationships are now available for use in GO-Elite.
If a user has multiple official database versions, they will be able to select the desired version when analyzing data or updating databases. Once the databases are installed, the user can choose to keep these databases, update or revert to a previous version if available or build new or modify existing databases using built in tools (see following sections).
GO-Elite Distributed ORA Resources
In GO-Elite version 1.2.4 a compendium of additional resources are optionally provided with installation of any Official species database download. Users must choose to download one or all of these additional resources during installation of a species database (Figure 5) or later from the Additional Resources update menu (Figure 18). These databases currently include: 1) Gene Ontology (GO), 2) Disease Ontology (CTDOntology), 3) Phenotype Ontology (MPhenoOntology), 4) GOSlim, 5) WikiPathways, 6) KEGG, 7) Transcription factor to target genes (TFTargets), 8) microRNA to target genes (microRNATargets), 9) InterPro and UniProt functional regions (Domains) and 10) Cellular biomarkers (BioMarkers).
For each ontology resource, ontology hierarchical structure files are included along with gene-to-ontology annotations for supported species (see below). For gene-sets (non-ontologies) gene or metabolite associations (WikiPathways and KEGG) are independently provided for selected species. Each resource is further described in the following section. Each resource can be updated from either the Official Database downloader (Download Species Database menu) or from the Additional Resources menu (see below).
Ontologies
Over-representation analysis (ORA) of ontology and gene-set resources is performed using same analysis method (Section 4). However, following ORA, ontology results are further pruned to eliminate biological terms in the same branch of the ontology tree, post ORA filtering, to reduce redundancy in the output. This results in a relatively unique and condensed list of specific terms to report. GO-Elite imports ontology term relationships in the form of a structured OBO flat file and gene-ontology relationships from central gene annotation repositories (NCBI, Ensembl, MGI, RGD). Additional ontologies and associated relationship files can easily be added using the update interface (see Updating and Adding Support for New Ontologies below – Figure 19).
Gene Ontology
OBO format Gene Ontology hierarchical relationships are provided with each official species database distribution or can updated from within the stand-alone version of GO-Elite (Section 5). These annotations include Biological Process, Molecular Function and Cellular Component relationships. These relationships are obtained from http://www.geneontology.org/ontology/gene_ontology.obo. In the standard database (e.g., EnsMart62), Gene Ontology gene associations are obtained only from Ensembl for each respective database build (Ensembl-GO). For the expanded database version (e.g., EnsMart62Plus), EntrezGene-GO annotations are obtained from ftp://ftp.ncbi.nlm.nih.gov/gene/DATA/gene2go.gz. Users can include GO annotations from any species annotated in this file using the stand-alone update options (Section 5). In this expanded database, Ensembl-GO is further augmented from inferred relationships obtained from EntrezGene-GO. When importing annotations from distributed gene-level Affymetrix annotation files, Ensembl-GO and EntrezGene-GO can optionally be built from these provided relationships.
Phenotype Ontology
OBO format phenoytpe ontology relationships are downloaded from ftp://ftp.informatics.jax.org/pub/reports/MPheno_OBO.ontology. Gene symbols from human and mouse and phenotype ontology associations are provided from ftp://ftp.informatics.jax.org/pub/reports/HMD_HumanPhenotype.rpt [4]. These combined gene symbols (lower cased symbols) are associated with Ensembl based using a simple inferred mapping strategy (matching lower-case gene symbol annotations), followed by translation to EntrezGene using Ensembl-EntrezGene relationship files provided with the respective GO-Elite species database build (e.g., EnsMart62Plus). Hence, relationships are provided for any mammalian species with matching gene symbols (case insensitive).
Disease Ontology
OBO format disease ontology relationships are downloaded from ftp://rgd.mcw.edu/pub/data_release/ontology_obo_files/disease/CTD.obo. Gene symbols are obtained either from ftp://rgd.mcw.edu/pub/data_release/annotated_rgd_objects_by_ontology for human, mouse or rat [5]. If other mammalian species are analyzed, all three species annotation files will be used to obtain gene symbols for inferred mapping to Ensembl (see Phenotype Ontology description). EntrezGene to disease ontology annotations are obtained using the Ensembl-EntrezGene relationship files in GO-Elite.
GOSlim
OBO format GOSlim ontology relationships are downloaded from http://www.geneontology.org/GO_slims/goslim_pir.obo. This resource is used since it provides relationships to all three branches of the GO hierarchy, unlike the generic GOSlim (http://www.geneontology.org/GO_slims/goslim_generic.obo). Gene relationships to GOSlim are provided by default with GO-Elite for many species by Ensembl (uid-gene directory). Translation to EntrezGene is obtained using the Ensembl-EntrezGene relationship files in GO-Elite.
Pathways and Gene-Sets
GO-Elite gene sets consist of biological pathway resources (WikiPathways and KEGG), regulatory relationships (transcription or miRNA binding targets), functionally annotated protein regions (domains) or cellular markers (biomarkers). Unlike ontologies, ORA is the primary method used to filter these results followed by gene content redundancy reporting (Section 4 – add details here). Hence, different qualitative measures can be obtained through these reports. Additional gene-sets can easily be added using the main analysis or update interface for multiple file formats (text files, GPML, OWL, GMT) (see Addition and Update of Species Databases below).
WikiPathways
WikiPathways (http://www.wikipathways.org) [6] is the central updated resource supported by GO-Elite, since daily updates are provided by this resource. WikiPathways relationships include gene to pathway and metabolite to pathway. For human, Reactome pathways are also provided in GO-Elite. Users can quickly update these relationships using the update interface in GO-Elite (Section 5). Relationships are extracted from species-specific zip file archives stored in GPML format from http://wikipathways.org/index.php/Download_Pathways. These graphical networks can be viewed at WikiPathways.org by searching for the WPID or visualized with data using the programs GenMAPP-CS or PathVisio. When using the GO-Elite function in GenMAPP-CS, WikiPathways can be directly selected and visualized with data after ORA (see example).
KEGG
KEGG pathway (http://www.genome.jp/kegg) [7] data is obtained from the PathVisio [8] website (http://www.pathvisio.org) through translation of the KEGG provided KGML to WikiPathways formatted GPML files. This resource is currently not updated, with annotations provided for Anopheles gambiae, Arabidopsis thaliana, Caenorhabditis elegans, Drosophila melanogaster, Danio rerio, Homo sapiens, Mus musculus, Oryza sativa, Rattus norvegicus, downloaded on 05/18/2011. Gene to KEGG pathway as well as metabolite to KEGG pathway relationships (Ensembl and EntrezGene) are available for analysis in GO-Elite for selected species.
Transcription Factor to Target Genes
This gene set contains experimentally determined transcription factor (TF) targets identified from published reports. Two compendiums were used to populate this database, the Amadeus Metazoan compendium (http://acgt.cs.tau.ac.il/amadeus) [9]and the PAZAR TF and regulatory sequence database (http://www.pazar.info) [10]. The Amadeus Metazoan compendium was downloaded from http://acgt.cs.tau.ac.il/amadeus/suppl/metazoan_compendium.htm. This database provides Ensembl gene relationships to 42 TF and miRNA target sets from Homo sapiens, mouse, Drosophila melanogaster and Caenorhabditis elegans. PAZAR is a large repository of public gene regulatory biology projects, which provides transcription factor to target gene associations from many experiments and public databases. These gene associations were obtained from http://www.pazar.info/cgi-bin/downloads_csv.pl. For both resources, gene symbols were extracted from the Ensembl gene IDs and inferred across mammalian species as describe for the Phenotype Ontology.
microRNA to Target Genes
Ensembl-microRNA associations were obtained from the program AltAnalyze [11] which incorporates microRNA binding site predictions from TargetScan, RNAhybrid. miRanda, miRBase and Pictar databases. To provide a more conservative set of predictions for human, mouse and rat, only miRNAs found in at least two of these miRNA binding site prediction resource were included. Details on this build process are available from http://www.altanalyze.org/help.htm#microrna. Associated EntrezGene relationships were obtained using the Ensembl-EntrezGene relationship files in GO-Elite.
InterPro and UniProt Functional Regions
Ensembl-Domain associations were obtained from the program AltAnalyze which incorporates InterPro domain transcription annotations from Ensembl and sequence features from UniProt. Details on this build process are available from http://www.altanalyze.org/help.htm#uniprot and http://www.altanalyze.org/help.htm#domain. Associated EntrezGene relationships were obtained using the Ensembl-EntrezGene relationship files in GO-Elite.
Cellular Biomarkers
Putative cell and tissue specific markers were predicted using the LineageProfiler package of AltAnalyze, currently in development. A large human and mouse compendium were of publically available microarray datasets (GEO) were used to identify gene sets for each cell type or tissue with the highest correlations to an idealized binary expression profile (0 for no expression in all cell types and 1 for expression in the target cell type). A manuscript is currently in preparation describing this resource and associated analysis tools by the AltAnalyze development team.
Modifying Species Databases
While the GO-Elite Official databases supports a large number species and gene relationships, the user may wish to add support for new species or add additional relationships not included in the existing databases. Users may also wish to add relationships to existing tables. All of these options are supported in GO-Elite through the Create/Modify Databases menu, available after selecting Update or Add Databases from the main menu (Figure 17). These options include:
1) Register any new species
2) Add/replace gene annotation files (e.g., Ensembl)
3) Add/augment/replace gene to Ontology or pathway relationship files.
4) Add/augment/replace gene relationship files (e.g., Affymetrix-EntrezGene).
When augmenting or replacing any existing gene relationship tables, this process is simple and straightforward. When building support for an unsupported species, this process is can also be straightforward, but requires the addition of all essential tables prior to data analysis (gene and gene-GO or gene-MAPP). These specific menu options are described in the following sections.
|
A |
B |
|
|
|
|
Figure 17. GO-Elite Create, Update and Modify Menu. A) Main database update options B) Specific update and new table support options. |
|
Integrating Additional Resources
The additional resources provided by GO-Elite (e.g., Disease Ontology, Transcription Factor Targets, WikiPathways, PathwayCommons) are updated frequently by the source databases (see GO-Elite Distributed ORA Resources). These include both gene and metabolite relationships. To ensure these relationships are as up-to-date as possible, users can select to update these resources, users can download the Create/Modify Databases menu. From the Additional Resources menu, simply select the species and resource you wish to update, or update All Resources (Figure 18).
|
|
|
Figure 18. Additional Resources Update Menu. Optional resources (gene and metabolite) to update or download for specific species (not all will be available for all species). |
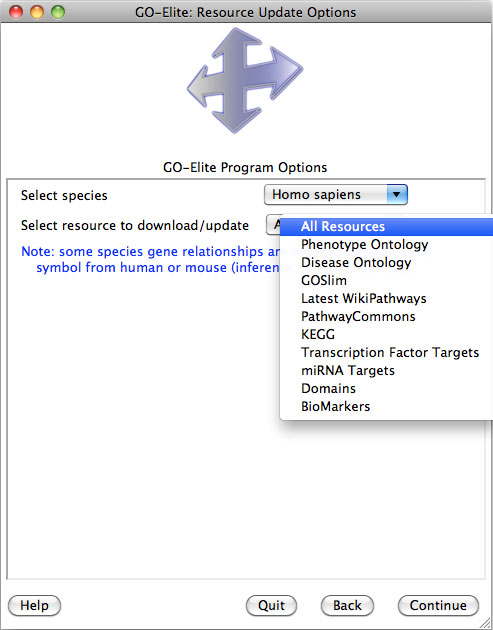
Updating and Adding Support for New Ontologies
Any version of the Gene Ontology or other Ontology tree structure annotations (OBO format) can be incorporated into the GO-Elite database. These annotations instruct GO-Elite which Ontology categories to analyze, which child gene associations to include with which parents and how to prune GO-Elite results. If the user simply wishes to download the very most recent GO annotations, the OBO format files will be automatically downloaded in GO-Elite by default. However, the user can also enter the URL of other Ontology OBO files (e.g., Cell Ontology). Whenever the adds or replaces an Ontology structure file, it is critical to also update the gene-Ontology associations (see Add Support for New Species and ID Systems or Update Existing).
|
|
|
Figure 19. Ontology Structure File Update. Update the default Gene Ontology OBO structure files or any other (new or supported). |
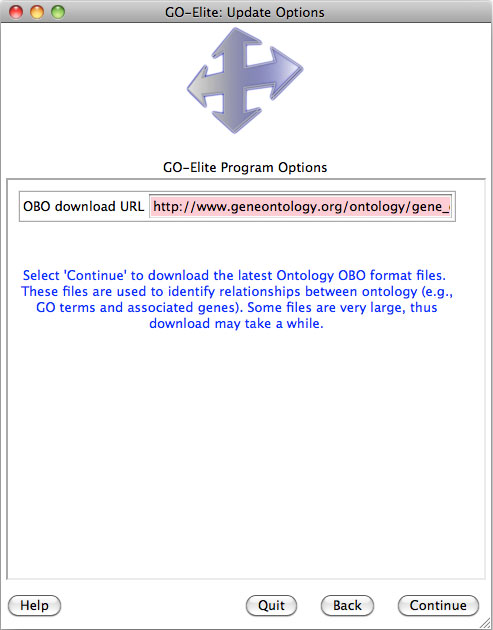
When ready to begin the file download, either accept the default Gene Ontology OBO file URL or supply another in the entry box and select "Continue" (Figure 19). This will replace any existing Ontology OBO format files with the latest and move any other OBO files to the sub-directory "archive". Once the OBO file is written, these Ontology relationships will be incorporated into the gene database immediately following any subsequent user analysis (if associated Ontology-MOD relationships are added (e.g., GeneOntology-Ensembl).
Updating Gene Ontology Relationships from EntrezGene
This function imports Gene Ontology to EntrezGene associations for any supported species at NCBI. To perform this action, select the option “EntrezGene-GO Associations”. Select your species of interest (e.g., Bos Taurus) or “all-supported”. Selecting “all-supported” will update all species in your database (Figure 20).
|
|
|
Figure 20. EntrezGene-to-GO Download. Incorporates the most up-to-date EntrezGene to Gene Ontology annotations for any species supported by NCBI. |
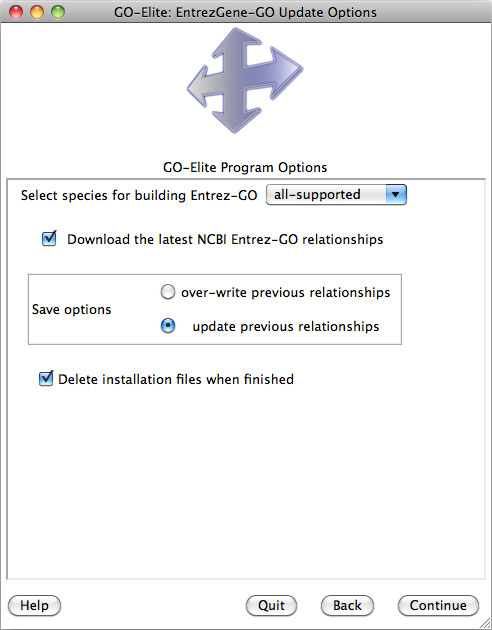
Keep or change the following default save options:
a. Download the latest NCBI Entrez-GO relationships. If this check-box is selected, GO-Elite will make sure to get the latest annotation files, even if you have previously downloaded and extracted annotations from EntrezGene. If not checked, GO-Elite will use the previously downloaded annotations.
b. Over-write previous relationships OR update previous relationships. The first option will replace the existing table entirely with the new information while the second option will add to the existing annotations.
c. Delete installation files when finished. This option will delete the large downloaded database file from NCBI containing all species EntrezGene-GO associations, when the check box is selected. Since these files are annotated frequently, it is recommended they are deleted after each run.
GO-Elite will download the necessary annotations and add support new EntrezGene to Gene Ontology relationships for that species.
Updating Affymetrix Relationships
In the GO-Elite databases with the suffix “Plus”, EntrezGene-to-Affymetrix, Ensembl-to-Affymetrix and EntrezGene basic annotations are extracted from Affymetrix provided annotation files for all available species and added to the database. However, a user may need to extract and integrate additional Affymetrix annotations on their own if:
1) The user wants to add archival Affymetrix annotations to an existing database
2) The user wants to add newer Affymetrix annotations to an existing database
3) A user wants to build a new species database from Affymetrix annotations provided in a custom microarray, not currently supported by GO-Elite
Although the Affymetrix annotations do not provide direct links between EntrezGene or Ensembl and Gene Ontology, this function can also infer these relationships from the Affymetrix annotation file(s). However, this option is only recommended with GeneOntology relationships cannot be directly gathered from either Ensembl or NCBI using the described GO-Elite methods. Open the menu “Affymetrix Annotation Files”. Select the species of interest (e.g., Bos Taurus) or “all-supported” (Figure 21).
|
|
|
Figure 21. Add Affymetrix Annotation File Relationships. Incorporate any standard array or custom array annotations saved in the standard Affymetrix .csv annotation format to the database. |
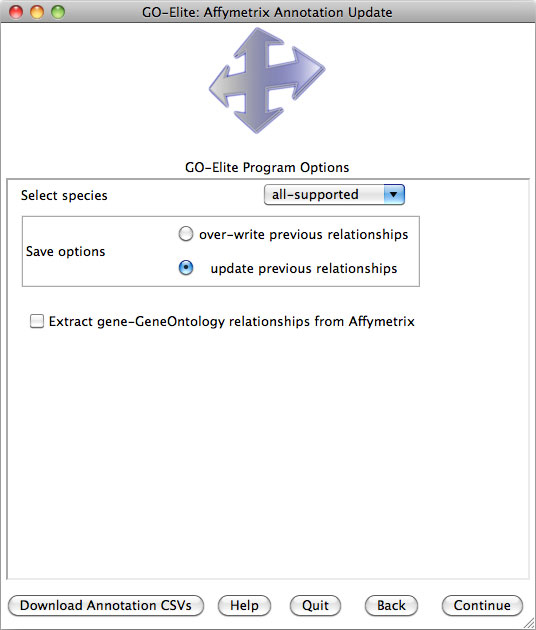
Keep or change the default save options:
a. Over-write previous relationships OR update previous relationships. The first option will replace the existing table entirely with the new information while the second option will add to the existing annotations.
b. Extract gene-GeneOntology information from Affymetrix. By default, this variable is set to “no”. Selecting “yes” will retrieve Ensembl and EntrezGene to Gene Ontology relationships and add these to the database. This option is only necessary when neither EntrezGene nor Ensembl to Gene Ontology relationships are already in the existing gene database.
Customized
Ensembl Release Builds
Existing or new GO-Elite databases can be built on the fly using the Ensembl update menu. This function should only be required if:
1) You require immediate access to the most recent version of Ensembl, prior to release by GO-Elite developers
2) You are an open-source developer building your own custom versions of GO-Elite databases
The Ensembl update function imports most critical data available from Ensembl for all supported species. This function downloads Ensembl SQL relationship files from the Ensembl website (http://www.ensembl.org). This includes any gene annotations in the Ensembl database for that species, including all annotations for all supported microrarrays. Thus, depending on the species, the combined downloads can be very large (>1GB). To run, select the option “Ensembl Annotations”. This will requires a web connection (may take 10 seconds to look up supported species). Select your species of interest (e.g., Bos Taurus) (Figure 22).
Additional Options:
a. Over-write previous relationships OR update previous relationships. The first option will replace the existing table entirely with the new information while the second option will add to the existing annotations.
b. Download the latest Ensembl relationships. If this check-box is selected, GO-Elite will make sure to get the latest annotation files, even if you have previously downloaded and extracted annotations from Ensembl (these are stored locally in the GO-Elite program directory under “BuildDBs”. If not checked, GO-Elite will use the previously downloaded annotations.
c. Delete installation files when finished. This option indicates whether to delete the downloaded Ensembl SQL files when finished. This is most typically desired, since these annotations are frequently updated and the downloaded files can be very large for mammalian model organisms.
a)
Once
these options are chosen, select “Continue”.
|
A |
|
|
B |
|
|
Figure 22. Ensembl Update Options. A) Species and release selection B) ID systems to include (various examples shown). |
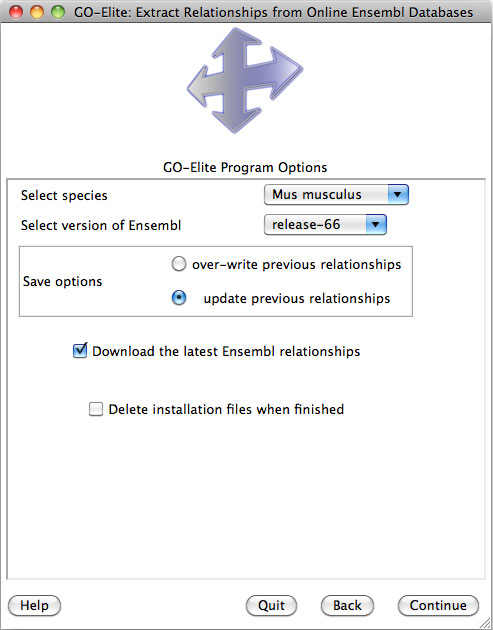
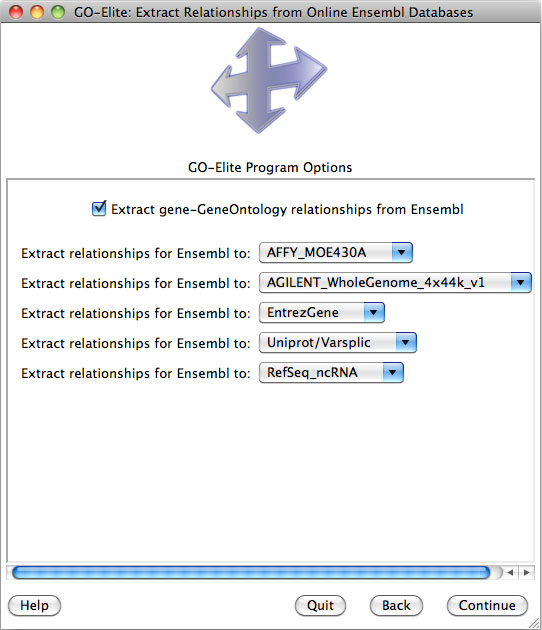
Select up-to five different annotation resources that you want to include in the GO-Elite database. The first option, “Extract gene-GeneOntology information from Ensembl”, retrieves Gene Ontology annotations for all of the latest Ensembl genes. The five dropdown menus contain a listing of all available annotation resources. Some examples are RefSeq, UniProt, Affymetrix, EntrezGene, UCSC, Unigene and GI. For example, if the data you are analyzing are Unigene IDs, by selecting to include Unigene to Ensembl, GO-Elite will add these relationships to the database along with the system code “Ug”. When the user then analyzes Unigene data, they will then add the System Code “Ug” to the second column of their input and denominator files for all IDs. To see the currently included Gene ID systems, go to the “Analyze ID Lists” menu under “GO-Elite Supported System Codes” option. Select “Continue” and GO-Elite will proceed to download the major components of the Ensembl database, for the current build for the selected species only. This process can take up-to two-hours and two hundred megabytes in downloaded files for species with diverse annotations. However, for most organisms, this process will be completed in under 10 minutes.
Add Support for New Species and ID Systems or Update Existing
New species and ID systems can be integrated into GO-Elite using the GUI Create/Modify Databases menu. From within this menu, select the option Your Own Text Files Existing databases can also easily be augmented or replaced from this menu (Figure 23).
|
A |
B |
|
|
|
|
Figure 23. GO-Elite Create, Update and Modify Menu. A) Main database update options B) Specific update and new table support options. |
|
Add a New Species
If your species of interest is not available from the Official GO-Elite databases, you can easily register this species name prior to adding additional tables for analysis. If no other species database is installed, GO-Elite will create all the necessary database directories in the folder Database for this species under the directory “EnsMart00”. Once you have registered a new species you will need to add tables to run an over-representation analysis (see options “Add New Gene System” and “Add New Relationship Table”). These ID systems and relationship files can be added from your own text files or from the other update menus (e.g., Affymetrix, EntrezGene-GO, Affymetrix Annotation Files or Additional Resources). To register a new species select the menu Add New Gene System from the menu Your Own Text Files. From the species selection dropdown menu, select “New Species” (last entry in the dropdown menu) and “Continue”.
|
|
|
Figure 24. Register a new species. User must include a species name and two-letter code (taxonomic ID is optional). |
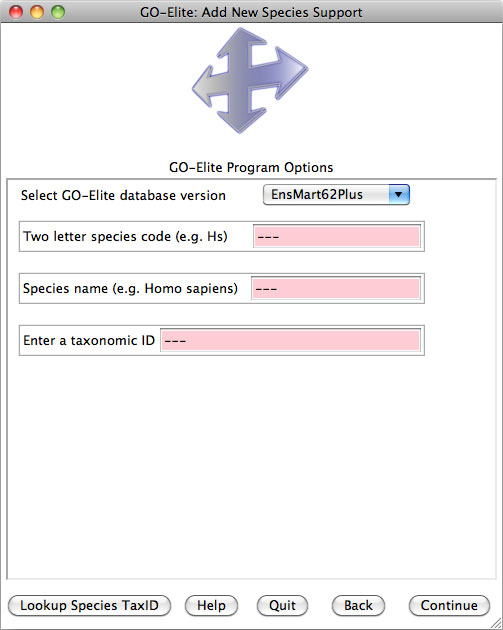
a) In the new window that appears (Figure 24), add the two-letter species code (e.g., Bt for Bos taurus), species name (e.g., Bos taurus) and taxonomic ID from NCBI for that species. To figure out which taxonomic ID applies to your species, select the button named “Lookup Species TaxID” at the bottom of the menu, enter the species name in the web browser and select the first link. For Bos Tuarus this is “9913”.
b) Select “Continue” once these fields are filled in.
c) Now your full species name will appear in the species dropdown menu for the update selections. Proceed with adding support for specific ID (gene or metabolite) and relationship systems (ontology, pathway or gene-set).
Add New Primary Gene or Metabolite System
Adding a new gene or metabolite ID system allows the user to add any relationship files that include the new gene system. For example, if add support for a new system named “Elite” you can then create additional tables that either directly or indirectly link these new IDs to existing or user designated primary gene relationships (aka MOD). Thus, “Elite” could link directly to Gene Ontology terms and pathways, and thus be a MOD or indirectly through an existing MOD, such as Ensembl.
a) To begin, select a species from the dropdown menu and the option “Add New Gene System” and “Continue”.
|
|
|
Figure 25. Add a New ID System. Register any new ID system name and abbreviation. When linking directly to pathways, ontologies or gene-sets, an annotation file must also be included. |
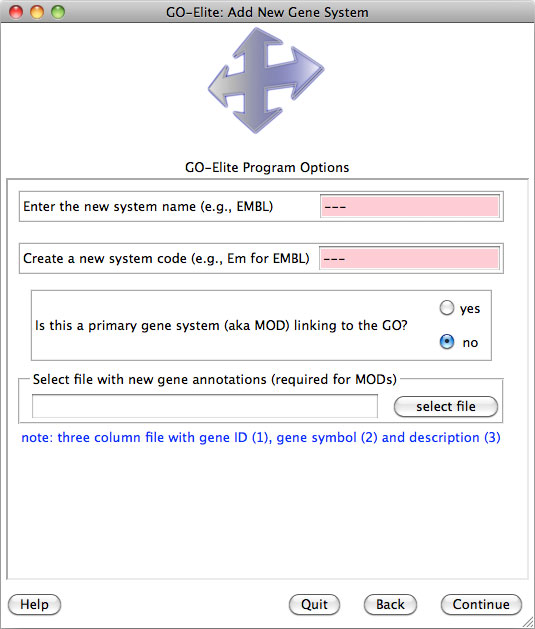
b) Once selected, you will be asked to enter a gene system name and gene system acronym (Figure 25). It is recommended that the acronym be two letters, but can be longer. You can add gene systems that are already in the database if you want to change the system name, system code or MOD status.
c) If the gene system will be used to directly link to Ontologies or pathways, you can designate this system as a MOD (Model Organism Database).
d) If this is a MOD you must also upload a three-column file containing gene annotations for that gene system. Although this interface can be used to add gene systems not currently in the gene database, for any species, it can be used to replace an existing gene annotation file or re-designate as a MOD.
e) Once completed, the existing relationship table will contain the new information from your three-column text file. To verify, you can open this annotation file in a spreadsheet editor, like Microsoft Excel (saved to the folder “Databases/EnsMart*build*/*species_code*/gene).
Add New Relationship Files
ID relationship files are essential for performing over-representation analysis (ORA) along Ontologies and pathways. There are three types of relationships files; 1) gene-GO, 2) gene-MAPP and 3) uid-gene. This first type contains relationships between your primary ID system (MOD) and any Ontologies. This primary ID system can be an existing one, such as Ensembl, or one added in the previous menu. The second type contains non-Ontology associations, to whichever pathway or gene-set annotations the user has. These can be from any desired source, including custom annotations. The third type of relationship file contains unique ID to primary gene system relationships. An example is Affymetrix to EntrezGene relationships. If the user’s data is Affymetrix IDs these can be analyzed for ORA when this table and EntrezGene-GeneOntology relationships are present. Typically, each ID within a primary gene system (MOD) represents a single genomic gene or unique metabolite. This is important when assessing over-representation of genes in a GO term or pathway, however, in specific cases where the user is not interested in gene level results a MOD can be used where each gene is linked to multiple MOD IDs.
a) Select a species from the dropdown menu and select the option Add New Relationship Table and “Continue”.
b) Two drop-down menus will be presented at the top of the selected window (Figure 26), one for the MOD and the other for the related IDs. Select the MOD and related IDs corresponding to the file you wish to upload. The file must be a tab-delimited text file with two columns; MOD (1) and ID relationship (2) for the designated systems. This file can also be any of the file types imported as a Custom Gene Set in Section 2 (e.g., GMT or GPML). If adding support for a new species, you will need to add MOD-GeneOntology or MOD-MAPP associations as a minimum to perform ORA.
c) When adding support for a new Ontology or gene-set (e.g., TRANSFAC associations from a GMT file), you will need to also indicate whether this is a gene-set or Ontology from the 3rd drop-down menu.
Repeat this process until all GeneOntology/Pathway and unique ID-MOD associations have been added. You can later modify these tables using the Update Existing Relationships Table menu if needed. Once complete, you are ready to analyze your data (see Section 2).
|
|
|
Figure 26. Add a New Relationship. New ID relationships can be added for any registered MOD or ID system. When adding support for a new Ontology, gene-sets or pathway, add the name of the resource as a concise name (e.g., CellOntology) and indicate whether it is an Ontology, Gene-Set or Pathway from the drop-down. |
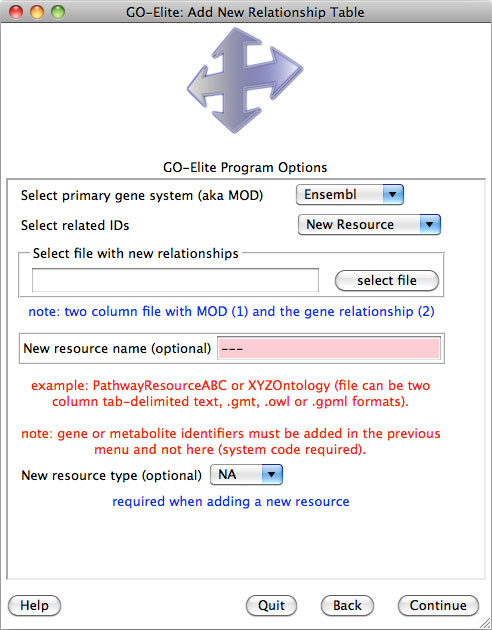
Updating Existing Relationships
If you have added your own custom tables in the past or wish to further customize existing tables, you can do this through the Update Existing Relationship option. This function assumes the relationship table of interest exists in the database. Before beginning, you must have a tab-delimited text file containing the MOD ID and associated ID of interest (e.g., Affymetrix or Gene Ontology).
a) To begin, select the species you want to analyze from the dropdown menu and Update Existing Relationship Table and select Continue”
b) In the selected window (Figure 27), select from any existing relationship table in the GO-Elite database. This includes gene-WikiPathway annotations (e.g., EntrezGene-MAPP), gene-GO (e.g., Ensembl-GeneOntology) and uid-gene (e.g., Ensembl-Affymetrix).
c) Select the relationship table and select the file from your computer that contains the relationships to add/replace. This table has two columns; the first needs to have the primary gene ID (aka MOD) and the second is the related ID.
d) Keep or change the default save options. These are:
1. Over-write previous relationships OR update previous relationships. The first option will replace the existing table entirely with the new information while the second option will add to the existing annotations.
e) Once completed, the existing relationship table will contain the new information from your two-column text file. To verify, you can open this relationship file in a spreadsheet editor, like Microsoft Excel (saved to the folder “Databases/EnsMart*build*/*species_code* in the designated output directory).
|
|
|
Figure 27. Update Existing Relationships. Import a table to augment or replace the existing relationship table. |
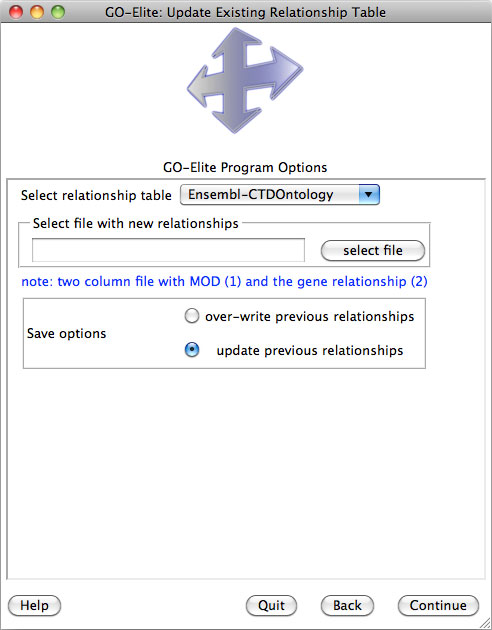
System Codes
While the user can add new ID systems to the GO-Elite database and add their own unique system code, by default, GO-Elite supports a variety of gene systems and existing system codes. The majority of these gene systems are extracted from Ensembl during the Official GO-Elite gene database build process. These system codes are typically identical to those used by the programs GenMAPP (http://www.genmapp.org) and PathVisio (http://www.pathvisio.org). For the current release of Ensembl (build 62), the following system codes are available among the different 64 support species. Add the appropriate system code to the second column of your input and denominator gene files (see section 2 of this document). The systems with the named "MOD" in the column "MOD_status" indicate that this ID system links directly to Gene Ontology or pathways (aka MAPPs) in the gene database. This system information can be modified through the "Update or Add Databases" menu. Note: The Ensembl database contains annotations for many microarray types. By default all non-genomic tiling array platforms In the Ensembl database that are not Affymetrix, Agilent, Codelink nor Illumina are assigned the system name MiscArray and the system code Ma.
|
SystemCode |
MOD_status |
|
|
Affymetrix |
X |
|
|
Agilent |
Ag |
|
|
BDGP_insitu_expr |
Bd |
|
|
CAS |
Ca |
|
|
CCDS |
Cc |
|
|
ChEBI |
Ce |
|
|
Cint |
Cj |
|
|
CioInt |
Cio |
|
|
CloneID |
Clb |
|
|
Codelink |
Co |
|
|
DBASS3 |
Dba |
|
|
DEDb |
De |
|
|
EMBL |
Em |
|
|
Ensembl |
En |
MOD |
|
ENST |
Enst |
|
|
EntrezGene |
L |
MOD |
|
EPD |
Epd |
|
|
Fantom |
Fa |
|
|
FlyBase |
F |
|
|
FlyGrid |
Fg |
|
|
GadFly |
Gf |
|
|
Genoscope_pred_gene |
Gen |
|
|
goslim_goa |
gos |
|
|
GPCR |
Gpcr |
|
|
HGNC |
Hg |
|
|
HMDB |
Ch |
MOD |
|
HPA |
Hpa |
|
|
Illumina |
Il |
|
|
IMGT |
Im |
|
|
IPI |
Ip |
|
|
KeggCompound |
Ck |
|
|
Kyotograil |
Ky |
|
|
MEROPS |
Merops |
|
|
MGI |
M |
|
|
MIM |
Mi |
|
|
miRBase |
Mb |
|
|
MiscArray |
Ma |
|
|
modCB |
Mg |
|
|
Osford_FGU |
Of |
|
|
OTT |
Ot |
|
|
PDB |
Pd |
|
|
Platypus_olfactory_receptor |
Pr |
|
|
ProteinID |
Pi |
|
|
PubChem |
Cp |
|
|
PUBMED |
Pu |
|
|
RefSeq |
Q |
|
|
RFAM |
Rf |
|
|
Sanger |
Sh |
|
|
SGD_TRANSCRIPT |
D |
|
|
sharesCDS |
Sc |
|
|
Symbol |
Sy |
|
|
TakRub |
Tak |
|
|
TetNig |
Tet |
|
|
Tgut_symbol |
Ts |
|
|
TransFac |
Transfac |
|
|
TubercuList |
Tb |
|
|
UCSC |
Ucsc |
|
|
UniGene |
Ug |
|
|
UniProt |
S |
|
|
Vega |
Vg |
|
|
Vega_transcript |
Vr |
|
|
Vega_translation |
Vt |
|
|
WikiGene |
Wg |
|
|
Wormbase |
Wb |
|
|
wormpep_id |
Wp |
|
|
Xenopus_Jamboree |
Xj |
|
|
XenTro |
Xen |
|
|
Zfin |
Z |
|
Table 3. Default Supported ID Systems. The available ID systems for immediate analysis in the GO-Elite are shown along with their two-letter system code. These codes are used to designate the ID system provided in the input and denominator files. The column “MOD_status” (original indicating Model Organism Database) indicates whether the system is a primary ID systems linked to ontologies, pathways and gene-sets. These include: En=Ensembl, L=EntrezGene and Ch=HMDB.
References
2. Pico, A.R., et al., WikiPathways: pathway editing for the people. PLoS Biol, 2008. 6(7): p. e184.