|
AltAnalyze
Information and Instructions Version 1.1
Beta Section 1 - Introduction1.1 Program Description AltAnalyze is composed of a set of modules designed to (A)
organize, filter, and summarize transcript tiling data; (B) calculate
scores for alternative splicing (AS), alternative promoter selection
(APS) or transcript elongation; (C) annotate
regulated alternative exon events; and (D) assess downstream predicted
functional consequences at the level of protein domains and microRNA
binding sites (miR-BS). The resulting data will be a series of text
files (results and over-representation analyses) that you can directly
open in a computer spreadsheet program for analysis and filtering. In
addition, export files are created for the Cytoscape [1] program DomainGraph, to graphically view domain and miR-BS probe set-exon alignments
and AltAnalyze statistics. Alternative exon analysis is currently compatible with the
Affymetrix Exon 1.0 ST array and the custom Affymetrix AltMouse A array,
however, it may be adapted to support other platforms on a per example
basis (contact author) or by other developers. Analysis of conventional Affymetrix microarrays is supported
for array normalization, calculation of array group statistics and dataset
annotation. 1.2 Implementation AltAnalyze
is provided as a stand-alone application that can be run on Windows
or Mac OS X operating systems, without installation of any additional
software. This software is composed of a set of distinct modules written
in the programming language Python. Python is a cross-platform compatible language; therefore, AltAnalyze
can be run on any operating system that has Python installed including
Linux and any future Mac OS X operating systems (python is included
standard). The AltAnalyze interface is an interactive graphic user interface
with easy to use options. To run AltAnalyze from source-code, rather than through
the stand-alone applications, see the AltAnalyze Google Groups page
(http://groups.google.com/group/alt_predictions) for more
information. 1.3 Requirements The basic installation of AltAnalyze requires a minimum of 1GB
of hard-drive space for all required databases and components. This includes support for all species and
currently supported arrays. Future versions may include an option for
automated download of databases specific to the user specified array
analyses.A minimum of 1GB of
RAM and Intel Pentium III processor speed are further recommended. At
least an additional 1GB of free hard-drive space is recommended for
building the required output files. 1.4 Pre-Processing, External Files and Applications AltAnalyze
can process raw Affymetrix image files (CEL files) using the RMA algorithm.
This algorithm is provided through Affymetrix Power Tools (APT) binaries
that are distributed with AltAnalyze in agreement with the GNU distribution
license (see agreement in the APT directory). In addition, users can
pre-process their data outside of AltAnalyze to obtain expression values
using any desired method. Example methods for obtaining such data include
ExpressionConsole (Affymetrix) and R (Bioconductor), either of which
can be used if the user desires another normalization algorithm rather
than RMA (e.g., GC-RMA, PLIER). If CEL files are processed directly by AltAnalyze (using APT
and RMA), two files will be produced; an expression file (containing
probe set and expression values for each array in your study) and a
detection above background (DABG) p-value file (containing corresponding
DABG p-values for each probe set).The
results produced by AltAnalyze will be identical to those produced by
APT or ExpressionConsole (http://www.affymetrix.com/products/software/specific/expression_console_software.affx). The only external files required by AltAnalyze are Affymetrix
library files (for array summarization) and Affymetrix gene annotation
files. Both of these files will be prompted for import in AltAnalyze
along with links provided for downloading. In
additional to expression analysis, users can optionally install the
program R (http://www.cran.org). R is optional when performing an exon-junction
array analysis using the algorithm Linear Regression with the rlm method (not needed for basic Linear Regression). Further
directions are provided to interface R in the algorithms. 1.5 Help with AltAnalyzeAdditional documentation, help, and
user discussions are available at the AltAnalyze website or at the AltAnalyze
Google Groups user forum: http://groups.google.com/group/alt_predictions Section 2 - Running AltAnalyze for Splicing Arrays2.1 Where to Save Input Expression Files? When performing analyses in AltAnalyze, the user needs to store
all of their Affymetrix CEL files in one directory. This directory can
be placed anywhere on your computer and will be later selected in AltAnalyze. Example files can be downloaded here. If the user has already run normalization on their CEL files
outside of AltAnalyze or have downloaded already analyzed expression
data from another source, you can save the expression and DABG p-value
file (optional) anywhere on your computer. These files should be tab
delimited text files that only consist of probe sets, expression values
and headers for each column. Example files can be downloaded here. 2.2 Beginning an AltAnalyze RunWindows
and Mac Directions: Once you have saved your CEL files or normalized expression
values to your computer, open the AltAnalyze application folder and
double-click on the executable file named "AltAnalyze.exe" (Windows)
or "AltAnalyze" (Mac).This will
open a set of user interface windows where you will be presented with
a series of program options (see following sections). Linux
and Source Code Directions: On Linux, move the files from the folder named "Source_code"
up one directory to the AltAnalyze application main folder. You can
start AltAnalyze by opening a terminal window and going to the AltAnalyze
main folder (e.g. "cd AltAnalyze_v1beta" from the program parent directory).
Once in this directory, typing "python AltAnalyze.py" in the terminal
window will begin to run AltAnalyze (you should see the AltAnalyze main
menu within a matter of seconds). AltAnalyze
Interface Options: There are many options in AltAnalyze, which allow the user to
customize their output, the types of analyses they run and the stringency
of those analyses. The following sections show the sequential steps
involved in running and navigating AltAnalyze. Interactive tutorials
for different analyses are provided through the AltAnalyze website.
1)
Introduction Window
- Upon Opening AltAnalyze, the user is presented with the AltAnalyze
splash screen and additional information. To directly open the AltAnalyze
download page, follow the hyperlink under "About AltAnalyze", otherwise
select "Begin Analysis".
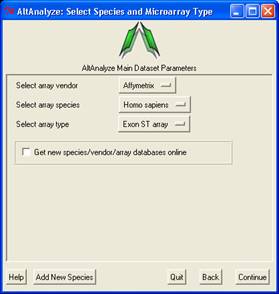
2)
Select species
- Next, the user must select a species for analysis. Select the species name and click "Continue".
For alternative exon analysis, AltAnalyze is only compatible with human,
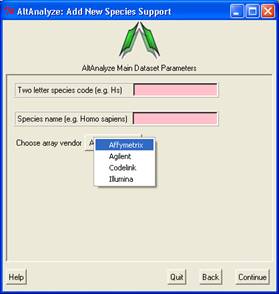
mouse and rat Affymetrix arrays. However, if the user wishes to analyze
data from a non-splicing array, that species can be added by selecting
"other" and "Continue".A window
named "Add New Species Support" will pop-up, where you can add a two
letter species code and full name that will be used for all current
and future analyses (Figure 2.1 B). Further support for new gene expression
arrays is added by downloading the Affymetrix CSV file for that array
(see below sections).
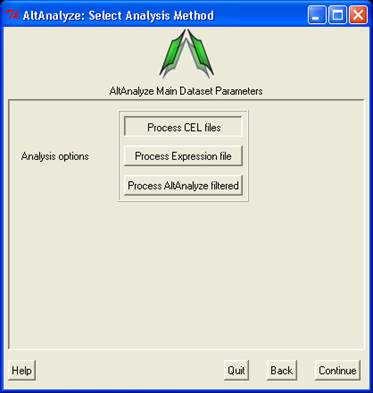
3)
Select analysis options and array type
- In this window, the user must select the type data being analyzed
and the type of array they will be using. There are three main types
of data; A) CEL files, B) Expression files and C) AltAnalyze filtered
files. Processing of CEL files will produce the two file types (expression
and DABG). Processing of Expression files, allows the user to select
tab-delimited text files where the data has already been processed (e.g.
RMA), which will also produce AltAnalyze filtered files. AltAnalyze
filtered files are written for any splicing array analysis (not for
gene expression only arrays). These files are the only required input for
a splicing analysis. Since CEL file normalization and array filtering
and summarization can take a considerable amount of time (depending
on the number of arrays), if re-performing an alternative exon analysis
with different parameters, it is recommended that the user select the
"Expression files" or "AltAnalyze filtered files", depending on which
options the user wants to change. There are four possible array types
that can be selected. Be sure to select the proper type indicated
by the array manufacturer and select "Continue".
4)
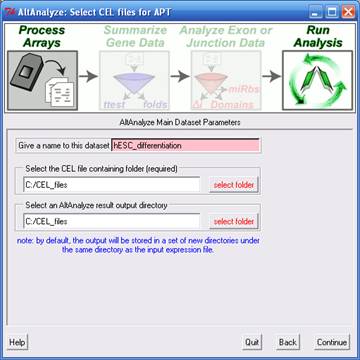
Processing Affymetrix CEL Files
- If you selected the "CEL files" data type from "Main Dataset Parameters",
you will be presented with a new window for selecting the location of
your CEL files, array library files and desired output directory. Clicking the "select folder" icon will allow
you to browse your hard-drive to select the folder with your CEL files.
You can double-check the correct directory is selected by looking at
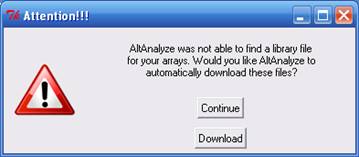
the adjacent text display. This window will be followed by an indicator
window that will automatically download the library and annotation files
for that array. If the array type is unrecognized and you do not already
have Affymetrix library files for your array (e.g. PGF or CDF), you
will need to download these files from the Affymetrix website. To do
so, select the link at the bottom left side of this window named "Download
Library Files". Select the array type being analyzed from the web page
and select the appropriate library files to download and extract to
your computer (requires an Affymetrix username and password) (Figure
2.3 B).
5)
Summarizing Gene Data and Filtering For Expression - After CEL file data summarization, a number
of options are available for summarizing gene level expression data
and filtering out probe sets prior to alternative exon analysis. For
splicing arrays, AltAnalyze calculates a "gene-expression" value based
on the mean expression of all constitutive probe sets that have a DABG
p-value less than the user indicated threshold for each gene. These
values are used to report predicted gene expression changes (independent of alternative splicing) for all user-defined comparisons
(see following section). In addition, fold changes and ttest p-values
are calculated for each of these group comparisons. These statistics
along with several types of gene annotations exported to a file in the
folder "ExpressionOutput" in the user-defined results directory. Along with this tab-delimited text file, a
similar file with those values most appropriate for import into the
pathway analysis program GenMAPP will also be produced (Figure 5.1).
For splicing analyses, probe sets with user defined splicing cutoffs
(expression and DABG p-values) will be retained for further analysis
(see section 5.2 - ExpressionBuilder algorithm).
6)
Select Alternative Exon Analysis Parameters
- If using
an exon-sensitive (e.g., Human Affymetrix
1.0 ST Exon array) or junction-sensitive microarray, the user will be
presented with specific options for that microarray (Figure 2.5). These
options include alternative exon analysis methods, statistical thresholds,
and options for additional analyses (e.g., MiDAS). The default options are recommended. These include restricting
the analysis to a conservative set of probe sets (e.g., "core") and
changing the threshold of splicing statistics. When complete, the user
can select "Continue" in AltAnalyze to incorporate these statistics
into the analysis.
7)
Assigning Groups to Samples
- When analyzing a dataset for the first time, the user will need to
establish which samples correspond to which groups. Type in the name
of the group adjacent to each sample name from in your dataset (Figure
2.6 A). 8)
Establishing Comparisons between Groups
- Once sample-to-group relationships are added, the user can list which
comparisons they wish to be performed (Figure 2.6 B). For splicing and
non-splicing arrays, folds and p-values will be calculated for each
comparison for the gene expression summary file. For splicing arrays,
each comparison will be run in AltAnalyze to identify alternative exons.
Thus, the more pair-wise comparisons the longer the analysis.
9)
Download Gene Annotations
- When running a non-splicing analysis for the first time, the user
will be prompted to download the proper probe set annotation file from
Affymetrix. Follow the link and instructions to download the appropriate
annotation CSV file for your microarray. NOTE: when an analyzing a splicing-array dataset,
it is also recommended that you have at least one Affymetrix annotation
CSV file in the indicated directory to link gene level results to Gene
Ontology and pathway annotations. Any Affymetrix CSV file for that species
is sufficient (genes not probe sets are matched).
10) AltAnalyze
Status Window - While the AltAnalyze program is running, several
intermediate results files will be created, including probe set, gene
and dataset level summaries (see section 2.3). The results window (Figure 2.8) will indicate
the progress of each analysis as it is running. When finished, AltAnalyze
will prompt the user that the analysis is finished and a new "Continue"
button will appear. In addition to viewing the program report, this
information is written to a log text file in the user-defined output
directory. 2.3 AltAnalyze Analysis OptionsThere is a number of analysis
options provided through the AltAnalyze interface. In this section will
overview these options for the different compatible array analyses (gene
expression arrays, exon arrays and junction arrays). For new users,
we recommend first running the program with the pre-set defaults and
then modifying the options as necessary. Selecting
The MicroArray Analysis Method After the user has selected
the species of interest, they must choose what type of data they will
next be analyzing. Data can consist of; 1) Affymetrix CEL files, 2)
an already processed expression text files or 3) properly formatted
and filtered AltAnalyze expression input text file. If beginning with
Affymetrix CEL files all three of these file types are produced in series
(see following section) and automatically processed without any user
intervention. If all CEL files from your study already been previously
in AltAnalyze or in another program, the user can load this file be
selecting the option "expression file" and choosing this text file from
your computer. This file needs to contain data from arrays corresponding
to at least two biological groups. Users may wish to re-analyze these
files to change their expression filtering parameters to be more or
less stringent. For the two or more biological groups (see how to define
in Figure 2.6), AltAnalyze will segregate the raw data based on the
user-defined pair-wise group comparisons and filter the containing probe
sets based on whether they match the user-defined thresholds for inclusion
and are associated with Ensembl genes (see the below section: Expression
Analysis Parameters). These files will be saved to the folder "AltExpression"
in the user-defined output directory. These files can be later selected
by choosing the option "AltAnalyze filtered", if the user wishes to
re-run or use different AltAnalyze alternative exon analysis options
(see below section: Alternative Exon Analysis Parameters).
CEL files are one of the
file types produced after scanning an Affymetrix microarray. The CEL
file is produced automatically from the DAT file (an image file, similar
to a JPEG), by the Affymetrix software by overlaying a grid over the
microarray florescent image and assigning a numeric value to each cell
or probe. From this file, expression values for each probe set can be
calculated and normalized for all arrays in the study using various
algorithms. When choosing to analyze CEL files in AltAnalyze, the user will be prompted to identify the folder containing the CEL files and the folder in which to save these other results to. The user will also need to assign a name to the dataset. These CEL files will be summarized using the RMA algorithm using the program Affymetrix Power Tools (APT). The APT C++ module "apt-probeset-summarize" is directly called by AltAnalyze when running AltAnalyze on a Mac, PC or Linux operating system. Unlike some other applications, APT is packaged with AltAnalyze and thus does not require separate installation. However, because it is a separate application there may be unknown compatibility issues that exist, depending on your specific system configuration and account privileges. For human and mouse exon arrays, AltAnalyze also allows for the masking of probes with cross-hybridization potential, prior to running RMA. This is performed through an experimental APT function (--kill-list), masking probes that are indicated in files produced for the MADS application (http://biogibbs.stanford.edu/~yxing/MADS/Annotation.html) that cross-hybridize to an off-target transcript within 3bp mismatches and a person correlation coefficient > 0.55, as per the MADS recommendations. APT
requires the presence of a library file(s) specific for that array.
AltAnalyze will automatically determine the array type and can install
these files if the user wishes (currently most human, rat and mouse
arrays supported). If AltAnalyze does not recognize the specific array
type or the user chooses to download these files themselves, they will
need to select the appropriate files when prompted in AltAnalyze. For
exon arrays, a PGF, CLF and antigenomic BGP file are required. These
files will be automatically downloaded and installed if the user selects
"Download" when prompted. For non-exon arrays, the appropriate CDF file
will be downloaded. In addition to these library files, a NetAffx CSV
annotation file will be downloaded that allows for addition of gene
annotations (non-exon arrays) and Gene Ontology pathway annotations
(all arrays). Once installed, AltAnalyze will recognize these files
and automatically use them for all future analyses. Once the user selects
the appropriate directories and files, the user will be prompted to
select the remaining options in AltAnalyze, before APT is run. Once run, an tab-delimited text expression
file will be produced for all probe sets on the array and a detection-above
background (DABG) p-value file (exon array only). Loading
a Processed Expression File If CEL files are processed outside of AltAnalyze, the user must save the resulting expression text file in tab-delimited format. It is alright if the first rows in the file have run information as long as they are followed by a pound sign (#).
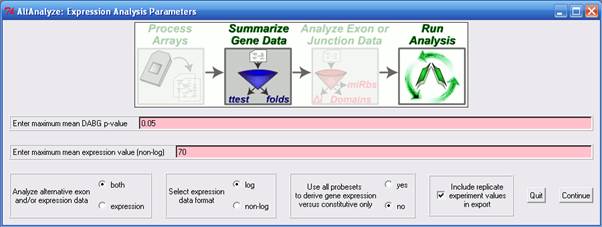
The options presented in
this interface (Figure 2.4) allow the user to determine what fields
are present in the gene expression output file, what scale the data
is in (e.g. logarithmic), which probe sets to use when calculating gene
expression and how to filter probe sets for subsequent analyses. 1)
Analyze alternative exon and/or expression data - Selecting the option "expression" will halt the analysis after
the gene expression result file has been written, such that no splicing
analysis is performed. This option is only available for splicing-sensitive
arrays. 2)
Select expression data format
- Indicates the format in which the CEL file summarized data has been
written. When the CEL files have been processed by AltAnalyze, ExpressionConsole,
APT, RMAExpress or through R, the file format will be logarithmic base
2 (log). If the user designates "not-log", then expression values will
be log base 2 (log2) transformed prior
to analysis. 3)
Use all probe sets to derive gene expression
versus constitutive only - For splicing sensitive microarrays, the user
has the choice to alter the way in which gene expression values are
calculated and how to filter their probe set expression files prior
to alternative exon analysis. When "yes" is selected for this option,
all probe sets linked to a unique gene will be used to calculate a measure
of gene expression by taking the mean expression of all probe set values.
When the "no" is selected, only those probe sets that have been annotated
as constitutive or common to all isoforms will be used for gene expression
calculation. In either case, only probe sets with at least
one array possessing a DABG p-value less than the user threshold will
be retained (if a DABG p-value file is present). In order to exclude
this threshold, set the minimum DABG p-value equal to 1. 4)
Include replicate experimental values in the
export - Instructs AltAnalyze whether to include the expression values
associated with each CEL file in the output file. If not selected only
the mean expression value of all CEL files for each biological group
will be written. 5)
Enter maximum mean DABG p-value
- When a DABG file has been produced (default when summarizing CEL files
with AltAnalyze for exon-arrays), this option is applied. The default
DABG p-value cutoff is p<0.05. This will filter out any non-constitutive
probe set that has a mean DABG p>0.05 for both compared biological
groups. For constitutive probe sets, both biological groups must have
a DABG p < user-value. In order to exclude this option, you can remove
the DABG file (contains the prefix "stats."), or set this value equal
to 1. 6)
Enter minimum mean expression value (non-log)
- This statistic is treated the same as the DABG p-value cutoff except
in that probe sets with a mean expression value less than this cutoff
will be excluded. The same rules apply to this value as to the DABG
value, where both variables must be true for probe set inclusion (e.g.,
p<0.05 and mean expression > 70). To exclude this option, set
the default value to 100,000 (greater than the maximum intensity value
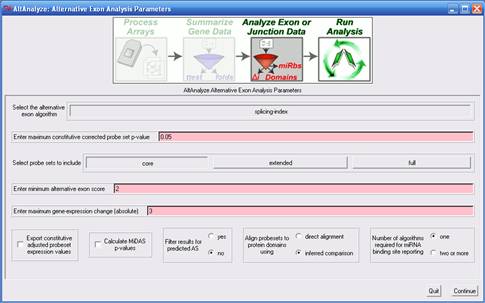
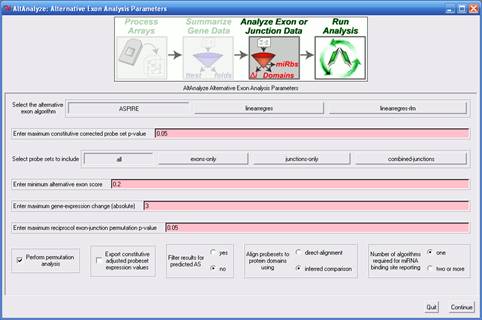
of most expression summaries). Alternative
Exon Analysis Parameters The options presented in
this menu (Figure 2.5) instruct AltAnalyze what statistical methods
to use when determining alternative exon expression, which probe sets
to select for analysis, what domain-level and miR-BS analyses to perform
and what additional values to export for analyses in other tools. Details
on each analysis algorithm are covered in detail in section 3.2. 1)
Select the alternative exon algorithm
- For exon arrays, the splicing index method is the only method currently
provided, however, for junction arrays, several methods are available.
These methods are used to calculate an alternative exon score, relative
to constitutive expression levels. The default value for splicing-index
analysis is 2, indicating that an adjusted expression difference greater
than two fold (up- or down-regulated) is required for the probe set
to be reported. Based on the algorithm, different values and scales
will apply. For junction-arrays, the ASPIRE algorithm default cutoff
is 0.2, whereas the linear-regression algorithm is 2. For linear-regression
(linearregres), a minimum value of 2 will select any linear-regression
fold greater than 2 (result folds are reported in log 2 scale, however),
up- or down-regulated, whereas ASPIRE's scores ranging from -1 to 1.
See algorithm descriptions for more details (section 3.2). 2)
Enter minimum alternative exon score
- This value will vary based on the alternative exon analysis method
chosen (see above options). 3)
Enter maximum constitutive corrected probe set
p-value - This is the p-value cutoff applied to MiDAS and splicing-index
ttest p-values for exon array analyses. Currently, the user cannot set
different p-value thresholds for these two statistics. More on MiDAS
can be found below and in section 3.2. 4)
Select probe sets to include
- This option is used to increase or decrease the stringency of the
analysis. In particular, this option allows the user to restrict what
type of probe sets are to be used to calculate an alternative exon score.
In the case of junction arrays, this option includes the ability to
merge the expression values of probe sets that measure the same differential
inclusion of an exon (combined-junctions). For exon arrays, there are
three options, "core", "extended" and "full". Although these are the
same probe set class names used by Affymetrix to group probe sets, AltAnalyze
uses a modification of these annotations. Specifically, probe sets with
the core annotation include all Affymetrix core probe sets that specifically
overlap with a single Ensembl gene [2]
(based on genomic position) along with any probe set that overlaps with
an Ensembl or UCSC exon [3].
Likewise, extended and full probe sets are those remaining probe sets
that also align to a single Ensembl gene, with the Affymetrix extended
or full annotation. 5)
Enter maximum gene-expression change (absolute) - This value indicates maximum constitutive
gene expression fold change (non-log, up- or down-regulated) that is
allowed for a gene to be reported as alternatively regulated. The default
is 3-fold, up or down-regulated. This filter is used with assumption
that alternative splicing is a less critical factor when a gene is highly
differentially expressed. 6)
Perform permutation analysis
- (junction
arrays only) This analysis reports a p-value that represents
the likelihood of the observed alternative exon score occurring by change,
after randomizing the expression values of all samples. 7)
Enter maximum reciprocal exon-junction permutation
p-value - (junction arrays only) This p-value
cutoff applies to the permutation based alternative exon score p-values
when performing ASPIRE or linearregress (see section 3.2). 8)
Export constitutive adjusted probeset expression
values - This option can be used to compare alternative
exon scores prior to filtering for biological multiple comparisons,
outside of AltAnalyze. For example, if comparing multiple tissues, the
user may wish to export all splicing-index scores for all tissue comparisons.
The results will be stored to the AltResults folder in the user-defined
output-directory. 9) Calculate MiDAS p-values - This statistic is analogous to the ttest p-value calculated during the splicing-index analysis (see section 3.2 for more details). If not selected, then only the splicing-index fold and p-value will be used to filter alternative exon results. 10) splicing-index
p-values - This is the p-value cutoff applied to splicing-index ttest p-values
for exon array analyses. More on this statistic can be found below and
in section 3.2. 11) Filter
results for predicted AS - This option instructs AltAnalyze to only include
regulated probe sets in the output that have been assigned a valid splicing
annotation (e.g., alternative-cassette exon) provided by AltAnalyze.
These annotations exclude probe sets with no annotations or those with
only an alternative N-terminal exon or alternative promoter annotation. 12) Align
probesets to protein domains using - This option is used to
restrict the annotation source for domain/feature over-representation
analysis. If "direct-alignment" is chosen, only those probe sets that
overlap with the genomic coordinates of a protein domains/features will
be included in the over-representation analysis, otherwise, the inferred
method is used (see section 3.2 for more details). 13) Number
of algorithms required for miRNA binding site reporting
- This option is used to filter out miR-BS predictions that only occur
in one of the four miR-BS databases examined. For more miR database
information see section 6.5. 2.4 Overview of Analysis ResultsAltAnalyze will output two main types
of files: 1)
Gene expression (GE) summary 2)
Alternative exon summary Gene
Expression Summary Data The GE summary files are two files that contain all computed
constitutive gene expression values from your dataset, saved to the
folder "ExpressionOutput" in the user-defined output directory. The first is a file is a complete dataset summary file with the
prefix "DATASET" followed by the user-defined dataset name containing
all array expression values (gene-level for exon arrays), calculated
group statistics (mean expression, folds, t-test p-values) and gene
annotations (e.g., gene symbol, description, Gene Ontology, pathway
and some custom groups). For exon arrays, the gene expression values
are derived from probe sets that align to regions of a gene that are
common to all transcripts and thus are informative for transcription
(unless all probe sets are selected - see "Select expression
analysis parameters", in Section 2.3). These probe sets are referred to as constitutive
probe sets. When one or more constitutive probe sets have DABG p-values
(for any array in the dataset) below the user defined threshold, these
probe sets will be used to calculate gene expression, otherwise, all
constitutive probe sets will be used. The second file, called the GenMAPP input file, contains a subset
of columns from the dataset summary file for import into GenMAPP [4] or PathVisio
[5] (http://www.pathvisio.org/PathVisio2).
This file has the prefix "GenMAPP" and excludes all gene annotations
and individual array expression values. Alternative
Exon Summary Data These results are produced from all probe sets that may suggest
alternative splicing, alterative promoter regulation, or any other variation
relative to the constitutive gene expression for that gene (derived
from comparisons file). Each set of results corresponds to a single
pair-wise comparison (e.g., cancer vs. normal) and will be named with
the group names you assigned. Four sets of results files are produced
in the end: 1)
Probe set-level - Probe set-level statistics, exon
annotations, AS/APS annotations, and functional predictions (protein,
domain and miRNA binding site). 2)
Gene-level - Gene-level summary of data in probe
set-level file. 3)
Domain-level - Over-representation analysis of gene-level
domain changes due alternative exon regulation. 4)
miRNA binding sites - Over-representation analysis
of gene-level, predicted miRNA binding sites present in alternatively
regulation exons. 5)
Summary statistics file - Global statistics, reporting
the number of genes alternatively regulated, number differentially expressed
and summary protein association information (e.g, mean regulated protein
length). Each file is a tab delimited text file that can be opened, sorted
and filtered in a spreadsheet program. These files are saved to the user-defined output directory under
"AltResults/AlternativeOutput", all with the same prefix (pair-wise
group comparisons). AltAnalyze will analyze all pair-wise comparisons
in succession and combine the probe set-level and gene-level results
into two additional separate files (named based on the splicing algorithm
chosen). Probe
set- and Gene-Level Alternative Exon Result Files The probe set-level file contains alternative
exon data for either one probe set (exon-array) or reciprocal probe
sets (junction array). This includes:
The gene-level file contains a summary
of the data at the gene level, with each row representing a unique gene. This file also includes: ·
Gene Ontology and pathway information for each gene extracted
from any Affymetrix CSV annotation files for that species present in
the directory "AltDatabase/Affymetrix/*species*". Protein
Feature and MicroRNA Binding Site Over Representation Files Over-representation analyses, (files
3 and 4) have the same structure:
Section
3 - Algorithms
Multiple algorithms are available in AltAnalyze to identify individual
probe sets (for exon arrays (EA)) or reciprocal probe sets (exon-exon
junction array (JA)) that are differentially regulated relative to constitutive
gene expression changes. These include the splicing index method (EA),
MiDAS (EA), ASPIRE (JA) and Linear Regression (JA). In addition to these statistical methods, several novel methods
are used to predict which alternative proteins correspond to a regulated
exon, which protein domain/features differ between these and which RNA
regulatory sequences differ between the associated transcripts (e.g.,
miR-BS). 3.1 Default Methods The default options are stored in external text files in the
folder "Config" as "defaults-expr.txt", "defaults-alt_exon.txt", and
"defaults-funct.txt".
These options correspond to those found in the configuration
file "options.txt". The user is welcome to modify the defaults and theoretically
even the options in the "options.txt" file, however, care is required
to ensure that these options are supported the by the program. Since AltAnalyze is an open-source program, it is feasible for
the user to add new species and array support or to do so with AltAnalyze
support. The default algorithms for the currently supported arrays are
as follows:
3.2 Algorithm DescriptionsSplicing
Index Method This algorithm is described in detail in the following publications: [6,7]. In brief, the expression value of each probe sets
for a condition is converted to log space (if necessary). For each probe
sets examined, its expression (log2) is
subtracted from mean expression of all constitutive aligning probe sets
to create a constitutive corrected log expression ratio (subtract instead
of divide when these values are in log space). This ratio is calculated for each microarray sample, using only
data from that sample.To derive
the splicing-index value, the group mean ratio of the control is subtracted
from the experimental.This value
is the change in exon-inclusion (delta I or dI). A t-test
p-value is calculated (two tailed, assuming unequal variance) by comparing
these ratios for all samples between the two experimental groups. A negative dI score of -1, thus indicates a two fold change in
the expression of probe set, relative to the mean constitutive expression,
with expression being higher in the experimental versus the control. MiDAS The MiDAS statistic is described in detail in the white paper: www.affymetrix.com/support/technical/whitepapers/exon_alt_transcript_analysis_whitepaper.pdf.
This analysis method is available from the computer program APT, mentioned
previously. APT uses a series of text files to examine the expression
values of each probe set compared to the expression of user supplied
constitutive probe sets.Since
AltAnalyze uses only probe sets found to align to a single Ensembl gene,
AltAnalyze creates it's own unique numerical gene identifiers (different
than the Affymetrix transcript clusters). When written, a conversion
file is also written that allows AltAnalyze to translate from this arbitrary
numerical ID back to an Ensembl gene ID. These relationships are stored
in the following files along with the probe set expression values:
When the user selects the option "Calculate
MiDAS p-values", AltAnalyze first exports expression data for selected
probe sets (e.g., AltAnalyze "core" annotated - Figure 2.5) to these
files for all pair-wise comparisons. Once exported, AltAnalyze will
communicate with the APT binary files packaged with AltAnalyze to run
the analysis remotely. These statistics will be clearly labeled in the
results file for each probe set and used for filtering based on the
user-defined p-value thresholds (Figure 2.5). Note: Different versions of the APT MiDAS binary have
been distributed. AltAnalyze is distributed with two versions that report
slightly different p-values. The older version (1.4.0) tends to report
larger p-values than the most recent distributed (1.10.1). Previous versions of AltAnalyze used version
1.4.0, while AltAnalyze version 1.1 uses MiDAS 1.10.1 that produces
p-values that are typically equivalent to those as the AltAnalyze calculated
splicing-index p-values (larger). ASPIRE For exon-exon junction microarray data (e.g., AltMouseA), the
algorithm analysis of splicing by isoform reciprocity or ASPIRE was
adapted from the original report [8] for inclusion
into AltAnalyze.This algorithm
uses the expression of probe sets aligning to two competitive exon-exon
junctions, or one exon-exon junction and an exon aligning probe set
along with constitutive expression values calculated as described with
the splicing-index method.These
probe set relationships were derived using the Affymetrix exon or exon-exon
junction names (e.g., E1-E3 and E2-E3 or E1-E3 and E2), obtained by
the Affymetrix AltMerge transcript assembly program [9]. For exon-exon
junctions and exons aligning to the same gene, reciprocal probe set
pairs were extracted using the ExonAnnotate_module.py program in
AltAnalyze using the identifyPutativeSpliceEvents function. Such splicing
events are classified as mutually-exclusive (mx-mx) or exon-inclusion/exon-exclusion
(ei-ex). Mutually-exclusive splicing events represent an exchange of
one exon for another (e.g., when E2-E4 and E1-E3 are compared, the E2
and E3 are considered regulated exons). For ei-ex, the proximal exon
in the compared junctions is considered the regulated exon (e.g., when
E1-E2 and E1-E3 are compared, E2 is the regulated exon). Similar to the splicing-index method, for each reciprocal probe
set, a ratio is calculated for expression of the probe set (non-log)
divided by the mean of all constitutive aligning probe sets (non-log),
for the baseline and experimental groups. The ASPIRE dI was then calculated for the inclusion (ratio1) and exclusion
(ratio2) probe sets, as such: Rin = baseline_ratio1/experimental_ratio1 ex = baseline_ratio2/experimental_ratio2 I1=baseline_ratio1/(baseline_ratio1+baseline_ratio2) I2=experimental_ratio1/(experimental_ratio1+experimental_ratio2) in1= ((Rex-1.0)*Rin)/(Rex-Rin) in2= (Rex-1.0)/(Rex-Rin) dI = ((in2-in1)+(I2-I1))/2.0 If (Rin>1 and Rex<1) or (Rin<1
and Rex>1) and the absolute dI score is
greater than the user supplied threshold (default is 0.2), then the
dI is retained for the next step in the analysis. If designated by the user, this next step
will be a permutation analysis of the raw input data to determine the
likelihood of each ASPIRE score occurring by chance alone. This permutation
p-value is calculated by first storing all possible combinations of
the two group comparisons. For example, if there are 4 samples (A-D)
corresponding to the control group and 5 (E-H) samples in the experimental
group, then all possible combinations of 4 and 5 samples would be stored
(e.g, [B, C, G, H] and [A, D, E, F]). For each permutation set, ASPIRE
scores were re-calculated and stored for all of these combinations.
The permutation p-value is the number of times that the absolute value
of a permutation ASPIRE score is greater than or equal to the absolute
value of the original ASPIRE score (value = x) divided by the number
of possible permutations that produced a valid ASPIRE score ((Rin>1
and Rex<1) or (Rin<1 and Rex>1)). If this p-value is less than user defined threshold, or x<2
(since some datasets have a small number of samples and thus little
power for this analysis), the reciprocal probe sets are reported. Linear
Regression When working
with the same type of reciprocal probe set data as ASPIRE, a linear
regression based approach can be used with similar results. This method
is based on previously described approach [10]. This algorithm
uses the same input ASPIRE (junction comparisons, constitutive adjusted
expression ratios). To derive the slope for each of the two biological
conditions (control and experimental), the constitutive corrected expression
of all samples for both reciprocal junctions is plotted against each
other to calculate a slope for each of the two biological groups using
the least squared method. In each case, the slope is forced through
the origin of the graph (model = y ~ x - 1 as opposed to y ~ x). The final linear regression score is the log2
ratio of the slope of the experimental group divided by the baseline
group. This ratio is analogous to a fold change, where 1 is equivalent
to a 2-fold change. When establishing cut-offs, select 2 to designate
a minimum 2-fold change. The same permutation analysis used for ASPIRE
is also available for this algorithm. Note: For
previous published analyses ([10] and
Salomonis et al. in preparation), linear regression was implemented
using the algorithm rlm, which is apart of the R mass package from bioconductor.
The Python R interpreter rpy, was used to run these analyses (which requires
installation of R). To use this option, select "linearregres-rlm" under
"select the alternative exon algorithm" (Figure 2.5). If a related warning
appears while running, you may need to load AltAnalyze.py and
associated source code directly (requires installation of R version
specific rpy - see Linux and Source Code AltAnalyze instructions). Domain/miR-BS
Over-Representation Analysis A z-score is calculated to assess over-representation of specific
protein features (e.g., domains) and miR-BS's found to overlap with
probe sets that are alternatively regulated according to the AltAnalyze
user analysis. This z-score is calculated by subtracting the expected
number of genes in with a protein feature or miR-BS meeting the criterion
(alternatively regulated with the user supplied thresholds) from the
observed number of genes and dividing by the standard deviation of the
observed number of genes. This z-score is a normal approximation to
the hypergeometric distribution. This equation is expressed as:
n = All genes associated with a given
element r = Alternatively regulated genes associated
with a given element N = All genes examined R = All alternatively regulated genes Once z-scores have been calculated for all protein features and
miR-BS linked to alternatively regulated probe sets, a permutation analysis
is performed to determine the likelihood of observing these z-scores
by chance. This is done by randomly selecting the same number of regulated
probe sets from all probe sets examined and recalculating z-scores for
all terms 2000 times. The likelihood of a z-score occurring by chance
is calculated as the number of times a permutation z-score is greater
than or equal to the original z-score divided by 2000. A Benjamini-Hochberg
correction is used to transform this p-value to adjusted for multiple hypothesis testing. 3.3 Alternative Splicing PredictionTo predict
whether or not a single probe set (EA) or reciprocal probe set-pair
(JA) associates with an alternative splicing or alternative promoter
sequence, AltAnalyze uses two strategies; 1) Identify alternative exons/introns
based on de novo isoform comparison
and 2) Incorporating splicing predictions from UCSC's "known_alt.txt"
file. De
Novo Splicing Prediction
and Exon Annotation 1'> In
order to identify exons with alternative splicing or promoters, AltAnalyze
compares all available gene transcripts from UCSC and Ensembl to look
for shared and different exons. To achieve this, all mRNA transcripts
from UCSC's species-specific "mRNA.txt" file that have genomic coordinates
aligning to a single Ensembl gene and all Ensembl transcripts from each
Ensembl build are extracted.Only
UCSC transcripts that have a distinct exon composition from Ensembl
transcripts are used in this analysis, excluding those that have a distinct
genomic start or stop position for the first and last exon respectively
(typically differing 5' and 3' UTR agreement), but identical exon-structure.
When assessing alternative splicing, cases of intron retention
are identified first. These regions consist of a single exon that spans
an two adjacent exons at least one another transcript for that same
gene. These retained introns are stored for later analysis, but eliminated
as annotated exons. Remaining exons are clustered based on whether their
genomic positions overlap (e.g., alternate 5' or 3' start sites). Each
exon cluster is considered an exon block with one or more regions, where
each block and region is assigned a numerical ID based on genomic rank (e.g., E1.1, E1.2, E2.1, E3.1). For each exon
in a transcript, the exon is annotated as corresponding to an exon block
and region number (Figure 3.1).All
possible pair-wise transcript comparisons for each gene are then performed
to identify exon pairs that show evidence of alternative exon-cassettes,
alternative 3' or 5' splice sites or alternative-N or -C terminal exons
(Figure 3.1). All transcript exon pairs are considered except for those
adjacent to a retained intron. This analysis is performed by comparing
the exon block ID and region IDs of an exon and it's neighboring exons
to the exon blocks and regions in the compared transcript. Ultimately,
a custom heuristic assigns the appropriate annotation based on these
transcript comparisons.
Incorporating
UCSC Splicing Predictions In
addition to all de novo splicing annotations, additional
splicing annotations are imported from the UCSC genome database and
linked to existing exon blocks and regions based on genomic coordinate
overlap.This comparison is performed
by the alignToKnownAlt.py module of AltAnalyze (called
from EnsemlbImport.py). De novo and
UCSC splicing annotations are stored along with probe set Ensembl gene
alignment data in the file <species>_Ensembl_probesets.txt. These annotations
are used by AltAnalyze and DomainGraph. Filtering for Alternative Splicing As
mentioned in previous sections, AltAnalyze includes the option restrict
alternative exon results to only those probe sets or reciprocal probe
set-pairs predicted to indicate alternative splicing. AltAnalyze considers alternative splicing as any alternative
exon annotation other than an alternative N-terminal exon or alternative
promoter annotation derived from de
novo or UCSC genome database annotations. 3.4 Protein/RNA Inference AnalysisIdentifying
Alternative Proteins Protein Domains Probe set sequences present on exon or junction arrays are used
to identify which proteins align to or are missing from transcripts
for that gene. To do this, all Ensembl and UCSC mRNA transcripts are
extracted for a gene that corresponds to a given probe set. For each
transcript, all exon genomic coordinates are stored. For exon arrays,
transcripts with exons that contain the probe set genomic coordinates
are considered transcript matches, while all others are considered non-matches.
For junction arrays, probe sets with sequence that directly aligns to
a transcript is considered a match. If two reciprocal junction probe
sets match to distinct isoforms, these relationships are stored rather
than the matching and non-matching isoforms, however, if both isoforms
do not match to distinct transcripts, then the one with a matching and
non-matching set of transcripts is stored for further exon comparisons.
If a set of matching and non-matching isoforms are identified
for a probe set or reciprocal junction pair, all possible match and
non-match pair-wise combinations are identified to find those pair-wise
comparisons with the smallest difference in exon composition. This is
accomplished by determining the number of different and common exons
each transcript pair contains (based on genomic start and stop of the
exon). When comparing the different transcript pairs, the most optimal
pair is selected by first considering the combined number of distinct
exons in both transcripts and second the number of common exons.
Thus, if one transcript pair has 4 exons in common and 2 exons not in
common, while a second pair has 5 exons in common and 3 exon not in
common, the prior will be selected as the optimal since it contains
less overall differences in exon composition (even though it has less
common exons than the other pair). A theoretical example is illustrated
in Figure 3.2.
Once a single optimal isoform pair has been identified, protein
sequence is obtained for each by identifying protein IDs that correspond
to the mRNA (Ensembl or NCBI) and if not available, a predicted protein
sequence is derived based on in
silico translation. Although such a protein sequence may not be
valid, given that translation of the protein may not occur, these sequences
provide AltAnalyze the basis for identifying conservative changes predictions
for a change in protein size, sequence and domain composition. Domain/protein
features are obtained directly from UniProt's sequence annotation features
or from Ensembl's InterPro sequence annotations (alignment e-value <1)
(see section 5 data extraction protocols). To compare domain sequence
composition differences, the protein sequence that corresponds to the
amino-acid start and stop positions of a domain for each transcript
is searched for in each of the compared isoforms. If a domain is present
in one but not another isoform, that domain is stored as differentially
present. To identify differences in protein sequence
(e.g., alternative-N-terminus, C-terminus, truncation coding sequence
and protein length), the two protein sequences are directly compared
for shared sequence in the first and last five residues and comparison
of the entire sequences. If the N-terminal sequence is common to both
isoforms but there is a reduction in more than 50% of the sequence length,
the comparison is annotated as truncated. All of these annotations are
stored for each probe set or junction pair for import into AltAnalyze,
for each new database build. The above strategy allows AltAnalyze to identify predicted protein
domains that are found in one isoform but not the other (aligning to
a probe set and not aligning). In addition to these "inferred" domain
predictions, that include protein domains that do not necessarily overlap
with the regulated probe set, AltAnalyze includes a distinct set of
annotations that only corresponds to probe set aligning domain predictions.
In the AltAnalyze alternative exon results file (suffix "exon-inclusion-results.txt"),
the column named "ens_overlapping_domains" reports Ensembl InterPro
IDs that directly overlap with the regulated probe set (domain name
proceeded by "direct"). Alignment of probe sets to InterPro IDs is
achieved by comparing probe set genomic coordinates to InterPro genomic
coordinates, where the probe set also directly aligns to the domain
containing Ensembl protein. In addition to these direct InterPro aligning
probe sets, probe sets that overlap with an InterPro's genomic coordinates,
but that do not directly align to that protein (that the InterPro aligns
to) are also reported as "indirect" aligning. These probe sets typically
occur in the gene introns. While these associations are typically meaningful,
false "indirect" associations are possible. To reduce the occurrences
of these false positives, any probe set that aligns to the UTR of an
Ensembl gene or that occurs in the first or last exon of an mRNA transcript
are excluded from the "indirect" analysis. These heuristics were chosen
after looking at specific examples that the authors considered to be
potential false positives. Identifying
microRNA Binding Sites associated with Alternative Exons MicroRNA binding site (miR-BS) sequence is obtained and compared
from four different microRNA databases (see section 6.5), and compared
to identify miR-BSs in common to or distinct to different
databases. Probe set sequences or exon sequences (aligning to two reciprocal
junctions) are obtained from Affymetrix (see section 6.7). Each miR-BS
sequence is searched for within probe set or exon sequence to identify
a match. These relationships are stored with each new database build
and are used by AltAnalyze and DomainGraph. Section 4 - Using External Programs with AltAnalyze
4.1 Configuring R Although installation of R is not required for any of
the AltAnalyze analyses, for users who wish to use more advanced statistics,
it will be necessary. Currently, the only statistic that requires installation
of R is the linear regression method rlm.
rlm
is a regression statistical method apart of the R package mss.
This method is preferred by some over the alternative linear regression
method provided by default in AltAnalyze. Both methods produce very
similar statistics, with only a few probe sets differing between threshold
parameters out of hundreds of results. However, since the rlm
method was used in the published linear regression analyses, other users
wishing to replicate these results, may wish to use this algorithm. To run the option "linearegress-rlm" from the "Alternative
Exon Analysis Parameters" window, you will need to install a compatible
version R (only version 2.1 has been extensively tested). Along with
R, the user will need to install the R statistical package mss. R is interpreted by Python using the Python
program Rpy, which is packaged with the compiled versions of AltAnalyze,
but not the source code (http://rpy.sourceforge.net/download.html).
With some compiled installations of AltAnalyze, you will receive a warning
when running "linearegress-rlm". This error
occurs due to an Rpy compiling error that is specific to the OS executable
version of AltAnalyze, but should work fine when Rpy is installed for
the associated version of R by the user (each version of Rpy corresponds
to several versions of R). Whether dealing with a compiled or source version of AltAnalyze,
if Python reports that it cannot find the current version of R, the
user may need to update the computers Environment Variables setting
Path (Windows only). This is accessed through by opening Control Panels>System
Properties>Advanced>Environment Variables and selecting the Variable
"Path" and entering the path location of R (for example, ";C:\Program
Files\R\rw2010;" - No spaces
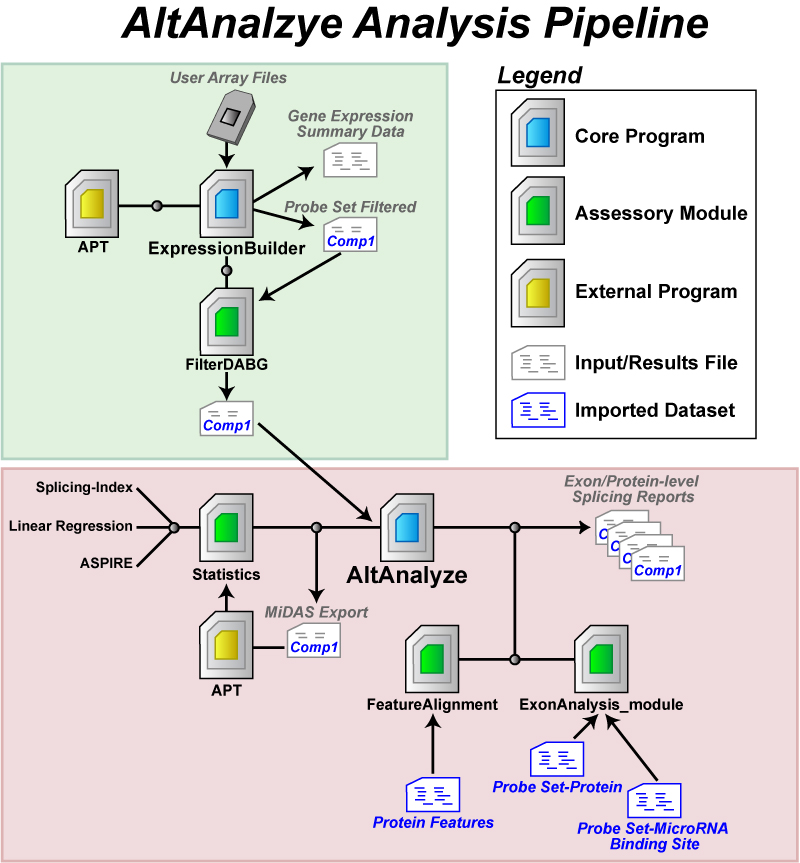
before or after ;). Contact AltAnalyze support if problems persist. Section 5 - Software Infrastructure5.1 Overview AltAnalyze consists of more than 30 modules and over 10,000 lines
of code. The core modules for AltAnalyze consist of the programs ExpressionBuilder
and AltAnalyze, which can be used in tandem or separately through the
AltAnalyze GUI. The user will never actually encounter these module
names when running AltAnalyze, but these distinct core modules are used
for different analysis functions (Figure 5.1).
The ExpressionBuilder component builds constitutive gene expression
summary files as well as filters the probe set expression data prior
to alternative-exon analysis. The AltAnalyze module performs all of
the alternative-exon analysis and MiDAS p-value calculations. 5.2 ExpressionBuilder ModuleThe ExpressionBuilder program is principally
designed to perform the following tasks: 1)
Import user expression data from tab-delimited files. 2)
(Splicing Arrays Only) Exclude probe sets where no samples
have a DABG p<user-threshold (only applicable when DABG p-values
exist). 3)
Organize your data according to biological groups and comparisons
(specified by the user from custom text files). 4)
(Exon Arrays Only) Calculate gene transcription levels for
all Ensembl genes. 5)
Export calculated gene expression values along with folds,
t-test p-values and gene annotations for all genes and all user indicated
comparisons. 6)
(Splicing Arrays Only) Export all gene linked probe set expression
and DABG data for all pair-wise comparisons (splicing array analysis
is restricted to two conditions), for further filtering (next step). 7)
(Splicing Arrays Only) Filter the resulting probe set data
using expression probabilities specific for the two pair-wise comparisons
and user-defined thresholds (Figure 2.4). The above tasks are performed in order by the ExpressionBuilder
module. Detection probabilities are assessed at two steps (2 and 7).
In step 2, import of DABG p-values are for the purpose of calculating
a transcription intensity value only for those constitutive probe sets
(present in all or most transcripts) that show detection above background,
since some probe sets will have weaker expression/hybridization profiles
as others. If no probe sets have a DABG p-value less than the default
or user supplied threshold (for at least one sample in your dataset),
all selected probe sets will be used to calculate expression (constitutive
aligning only if default is selected). In step 7, the probe set DABG p-values are examined to include
or exclude probe sets for alternative splicing analysis. This step is
important in minimizing false positive splicing calls. False positive splicing calls can occur when a probe set is expressed
below detectable limits and results in a transcription-corrected expression
value that artificially appears to be alternatively regulated. ExpressionBuilder
output an expression file and DABG p-value file containing all probe
set expression values that are linked to unique gene identifiers (e.g.,
aligns to a Ensmbl gene ID) for all user-defined pair-wise comparisons.
The FilterDABG module uses these two files to identify constitutive
probe sets (considered common to all transcripts) with a mean DABG p<user-defined
threshold and mean expression > user-defined threshold for both biological
groups. If a probe set is non-constitutive, then for at least one of
the two biological groups, the same criterion must be true (mean DABG
p-value and expression). These filters ensure that: 1) the gene is "expressed"
in both conditions and 2) the probe set is "expressed" in at least one
condition. The probe sets and expression values passing these user defined
filters are exported to a new file that is ready to use for splicing
analyses. This file can also be directly selected in
future AltAnalyze runs as input for analysis ("AltAnalyze filtered file"
- Figure 2.2). Runtime of ExpressionBuilder is dependent on the number of conditions
and array type being analyzed (10 minutes plus for Affymetrix Exon 1.0
ST arrays). If multiple comparisons are present in a single expression
file, input files for AltAnalyze will all be generated at once and thus
runtimes will take longer. Note 1: While this pipeline is mainly for use with exon
or junction arrays, it is also compatible with a standard 3' Affymetrix
microarray dataset to calculate folds, t-test p-values and assign annotations
to this data.This is useful
when you have many comparisons in your dataset and you don't wish to
manually calculate these values. Note 2: You do not need to run ExpressionBuilder if you
have an alternative way of building AltAnalyze input files. To do so,
your file headers for each array must have the name "group:sample_name",
where your group names are different for each group and the denominator
group is listed first and the numerator is listed second. Below the
header line should only be probe set IDs and log2 expression values. 5.3 AltAnalyze ModuleThe AltAnalyze module is the primary
software used for all alternative exon analyses. This software imports
the filtered expression data and performs all downstream statistical
and functional analyses.This
program will analyze any number of input comparison files that are in
the "AltExpression" results directory for that array type. The main
analysis steps in this program are: 1)
Import exon or junction annotations, to determine which probe
sets to analyze, which are predicted constitutive probe sets and which
correspond to known AS or APS events. 2)
Import the user expression data for the pair-wise comparison. 3)
Store probe set level data for all probe sets corresponding
to either a constitutive exon or for splicing event, while storing the
group membership for each value. 4)
Calculate a constitutive expression value for each gene and
each sample (used for the splicing score later on). OPTIONAL: If the
user selected a cut-off for constitutive fold changes allowed to look
at alternative exon regulation, then remove genes from the analysis
that have a gene-expression difference between the two groups > cut-off
(up or down). 5)
(Exon array only) OPTIONAL: exports input for the
Affymetrix Power Tools (APT) program to calculate a MiDAS p-value for
each probe set. If using this option. 6)
Calculate a splicing score and t-test p-value from the probe
set and constitutive expression values. This calculation requires that
splicing ratios are calculate for each sample (exon/constitutive expression)
and then compared between groups. For exon arrays, the splicing index
method (SI) is calculated for each probe set. For junction arrays, ASPIRE,
Linear Regression are used with the pre-determined reciprocal junctions
or alternatively are calculated for individual probe sets using the
SI method. 7)
(Junction array only) OPTIONAL:
performs a permutation analysis of the sample ASPIRE input values or
Linear Regression values to calculate a likelihood p-value for all possible
sample combinations. 8)
Retain only probe sets meeting the scoring thresholds for
these statistics (splicing score, splicing t-test p, permutation p,
MiDAS p - see Section 3.2). 9)
Import probe set-protein, probe set-domain and probe set-miRNA
associations pre-built local from flat files (see Section 6). 10) For the remaining
probe sets, import all protein domain and miR-BS to all pre-built probe
set associations (see Section 3.3 for details). Import all probe set-domain
and -miR-BS associations for all genes to calculate an over-representation
z-score for all domains and miR-BS's along with a non-adjusted and adjusted
p-value. Export the resulting statistics and annotations to tab-delimited
files in the "AltResutls/AlternativeOutput" folder in the user-defined
output directory. 11) (Junction array
only) Import splicing and exon annotations for regulated exons
corresponding to each set of reciprocal probe sets (e.g. for E1-E3 compared
to E1-E2, E2 is the regulated exon). These annotation files are the
same as those for exon arrays, except that the probe set is replaced
by the exon predicted to be regulated by the reciprocal probe set-pair
(see Section 6.2). 12) For protein
domain and miR-BS annotations, reformat the direction/inclusion status
of the annotation.For example,
if a kinase domain is only found in a protein that aligns to a robe
set, but was down-regulated, then the annotation is listed as (-) kinase
domain, but if up-regulated is listed as (+) kinase domain. 13) Export the
results from this analysis to the "AltResutls/AlternativeOutput" folder
in the user-defined output directory. 14) Summarize the
probe set or reciprocal junction data at the level of genes and export
these results (along with Gene Ontology/Pathway annotations). 15) Export overall
statistics from this run (e.g. number of genes regulated, splicing events). 16) (Junction array
only) Combine and export the exported probe set and gene files
for each comparison analyzed, to compare and contrast differences. Result
File Types When finished AltAnalyze will have generated
five files. 1)
name-scoringmethod-exon-inclusion-GENE-results.txt 2)
name-scoringmethod-exon-inclusion-results.txt 3)
name-scoringmethod-ft-domain-zscores.txt 4)
name-scoringmethod-miRNA-zscores.txt 5)
name-scoringmethod-DomainGraph.txt Here, "name" indicates the comparison file name from ExpressionBuilder,
composed of the species + array_type + comparison_name (e.g. Hs_Exon_H9-CS-d40_vs_H9-ESC-d0),
"scoringmethod" is the type of algorithm used (e.g. SI) and the suffix
indicates the type of file. The annotation files used by AltAnalyze are pre-built using other
modules with this application (see Section 6). Although the user should not need to re-build these files on
their own, advanced users may wish to modify these tables manually or
with programs provided (see Section 6.7). For protein-level functional annotations (e.g., domain changes),
this software assumes that if an exon is up-regulated in a certain condition,
that the protein domain is also up-regulated and indicates it as such.
For example, for exon array data, if a probe set is up-regulated (relative
to gene constitutive expression) in an experimental group and this domain
is found in the protein aligning to this probe set, in the results file
this will be annotated as (+) domain. If the probe set were down-regulated
(and aligns as indicated), this would be annotated as (-) domain. Section
6 - Building AltAnalyze Annotation Files
6.1 Splicing Annotations and Protein AssociationsA number of annotation files are built
prior to running AltAnalyze that are necessary for: 1)
Organizing exons and introns from discrete transcripts into
consistently ordered sequence blocks (UCSCImport.py and EnsemblImport.py). 2)
Identifying which exons and introns align to alternative
annotations (alignToKnownAlt.py and EnsemblImport.py). 3)
Identifying probe sets with likely constitutive annotations
(ExonArrayAffyRules.py). 4)
Identifying which probe sets align to which exons and introns
(ExonArrayEnsemblRules.py). 5)
Extracting out protein sequences with functional annotations
(ExtractUniProtFunctAnnot.py and EnsemblSQL.py). 6)
Identifying probe sets that overlap with microRNA binding
sites (MatchMiRTargetPredictions.py and ExonSeqModule.py). 7)
Matching probe set genomic coordinates to cDNA exon coordinates
and identify the optimal matching and non-matching mRNA/protein for
each probe set (IdentifyAltIsoforms.py
and ExonAnalyze_module.py) These annotation files are necessary
for all exon and junction array analyses. Junction array analyses further require: 8)
Matching reciprocal junction probe sets to annotated exons
or introns (JunctionArray.py, EnsemblImport.py and JunctionArrayEnsemblRules.py), creating
a file analogous to (4) above. 9)
Matching reciprocal junction probe set sequence to microRNA
binding sites (JunctionSeqSearch.py), creating
a file analogous to (6) above. 10) Matching probe
set sequence to cDNA sequences (mRNASeqAlign.py), prior to
identification of optimal matching and non-matching mRNA/proteins (IdentifyAltIsoforms.py). With the creation/update of these files, the user is ready perform
alternative exon analyses for the selected species and array type. Since many of these analyses utilize genomic
coordinate alignment as opposed to direct sequence comparison, it is
import to ensure that all files were derived from the same genomic assembly.
Note: Although
all necessary files are available with the AltAnalyze program at installation
and some files can be updated automatically from the AltAnalyze server,
users can use these programs to adjust the content of these files, use
the output for alternative analyses, or create custom databases for
currently unsupported species. 6.2 Building Ensembl-Probe Set Associations
Affymetrix Exon 1.0 ST arrays are provided
with probe set sequence, transcript cluster, probe set genomic location,
and mRNA count annotations.Each
of these annotations are used by AltAnalyze to provide detailed sub-gene
associations. Although transcript clusters represent putative genes,
the AltAnalyze pipeline derives new gene associations to Ensembl genes,
so that each probe set aligns to a single gene from a single gene database.
This annotation schema further allows AltAnalyze to determine which
probe sets align to defined exons regions (with external exon annotations),
introns, and untranslated regions (UTR). To begin this process, Ensembl exons (each with a unique ID)
and their genomic location and transcript associations are downloaded
for the most recent genomic assembly using the EnsemblSQL.py module, which parses various files on
the Ensembl FTP SQL database server to assemble the required fields. This file is saved to the directory "AltDatabase/ensembl/*species*/"
with the filename "*species*_Ensembl_transcript-annotations.txt". Since Ensembl transcript associations are
typically conservative, transcript associations are further augmented
with exon-transcript structure data from the UCSC genome database, from
the file "all_mrna.txt" (Downloads/*species*/Annotation database/all_mrna.txt.gz).
This file encodes genomic coordinates for exons in each transcript similar
to Ensembl.Transcript genomic
coordinates and genomic strand data from UCSC is matched to Ensembl
gene coordinates to identify genes that specifically overlap with Ensembl
genes with the Python program UCSCImport.py. Unique transcripts,
with distinct exon structures from Ensembl, are exported to the folder
"AltDatabase/ucsc/*species* "*species*_UCSC_transcript_structure_filtered_mrna.txt",
with the same structure as the Ensembl_transcript-annotations file.
Once both transcript-structure files have been saved to the appropriate
directory, ExonArrayAffyRules.py
calls the program
EnsemblImport.py to perform
the following steps: 1)
Imports these two files, stores exon-transcript associations
identify exon regions to exclude from further annotations. These are
exons that signify intron retention (overlapping with two adjacent spliced
exons) and thus are excluded as valid exon IDs. These regions are also flagged as intron-retention
regions for later probe set annotations. 2)
Assembles exons from all transcripts for a gene into discrete
exon clusters.If an exon cluster
contains multiple exons with distinct boundaries, the exon cluster is
divided into regions that represent putative alternative splice sites
(Figure 3.1). These splice sites explicitly annotated downstream. Each
exon cluster is ordered and number from the first to the last exon cluster
(e.g., E1, E2, E3, E4, E5), composed of one or more regions. These exon
cluster/region coordinates and annotations are stored in memory for
downstream probe set alignment in the module ExonArrayAffyRules.py. 3)
Identifies alternative splicing events (cassette-exon inclusion,
alternative 3' or 5' splice sites, alternative N-terminal and C-terminal
exons, and combinations there in) for all Ensembl and UCSC transcripts
by comparing exon cluster and region numbers for all pairs of exons
in each transcript (Figure 3.2). Alternative exons/exon-regions and
corresponding exon-junctions are stored in memory for later probe set
annotation and exported to summary files for creation of databases for
the Cytoscape exon structure viewer, SubgeneViewer (currently in development). Upon completion, ExonArrayAffyRules.py: 1)
Imports Affymetrix Exon 1.0 ST probe sets genomic locations,
transcript cluster, and mRNA counts from the Affymetrix probe set.csv
annotation file (e.g., HuEx-1_0-st-v2.na23.hg18.probeset.csv). Although
transcript clusters will be disregarded at the end of the analysis,
these are used initially to group probe sets. 2)
Transcript cluster genomic locations are matched to Ensembl genes genomic
locations (gene start and stop) to identify single transcript clusters
that align to only one Ensembl gene for the respective genomic strand.
For transcript clusters aligning to more than one Ensembl gene, coordinates
for each individual probe set are matched to aligning Ensembl genes,
to identify unique matches. If multiple transcript clusters align to
a single Ensembl gene, only probe sets with an Affymetrix annotated
annotation corresponding to that Ensembl gene, from the probeset.csv
file are stored as proper relationships. This ensures that if other
genes, not annotated by Ensembl exist in the same genomic interval,
that they will not be inaccurately combined with a nearby Ensembl gene. If multiple associations or other inconsistencies
are found, match probe set coordinates directly to the exon cluster
locations derived in EnsemblImport.py. 3)
Once
unique probe set-to-Ensembl gene associations have been defined, constitutive
probe sets are identified using the Affymetrix mRNA counts provided
in the program ExonArrayEnsemblRules.py.The mRNA
counts are distributed based on the types of mRNAs they align to (full-length,
Ensembl, and EST), where the probe sets with the largest number of high
quality mRNA associations are chosen as constitutive. Probe sets for
a given gene are ranked based on the: A) number of Ensembl transcripts,
B) full-length and C) ESTs associated, in descending order, where multiple
associations are required for each annotation type. If all probe sets
have the same number of Ensembl and full-length transcript associations,
then the number of EST aligning are compared. If no difference in these mRNA assignments exists, no constitutive
probe sets are annotated. 4)
Each
probe sets is then aligned to exon clusters, regions, retained introns,
and splicing annotations for that gene. In addition to splicing annotations
from EnsemblImport.py, splicing annotations from the UCSC genome annotation
file "knownAlt.txt" (found in the same server directory at UCSC as "all_mRNA.txt")
using the program alignToKnownAlt.py, are aligned to these probe sets. If a probe set
does not align to an Ensemblmport.py defined exon or intron and is upstream of the first exon or downstream
of the last exon, the probe set is assigned a UTR annotation (e.g.,
U1.1). All aligning probe sets are annotated based on the exon cluster
number and the relative position of that probe set in the exon cluster,
based on relative 5' genomic start (e.g., E2.1). This can mean that
probe set E2.1 actually aligns to the second exon cluster in that gene
in any of the exon regions (not necessarily the first exon region),
if it is the most 5' aligning. 5)
These
probe set annotations are exported to the directory "AltDatabase/*species*/exon"
with the filename "*species* _Ensembl_probe
sets.txt". Exon block and region annotations for each probe set are
designated in the AltAnalyze result file.
For the exon-junction array AltMouseA,
the same process is applied to the highlighted exon(s) from all pre-determined
reciprocal probe sets, exported by the program ExonAnnotate_module.py.A highlighted
exon is an exon that is considered to be regulated as the result of
two alternative junctions.For
example, if examining the exon-junctions E1-E2 and E1-E3, E2 would be
the highlighted exon. Alternatively, for the mutually-exclusive splicing
event E2-E4 and E1-E3, E2 and E3 would be considered to be the highlighted
exons. To obtain the genomic locations of these exons, sequences for
each are obtained from a static build of the mouse AltMerge program
(March 2002) (ExonAnalyze_module.py) and searched for in FASTA formatted sequence obtained
from BioMart for all Ensembl genes with an additional 2 kb upstream
and downstream sequence (JunctionArray.py and EnsemblImport.py).This allows
for the export of an exon-coordinate file analogous to the exon probeset.csv
file.The main difference in
this file is that AltMouseA gene to Ensembl ID associations are obtained
by comparing gene symbol names and external GenBank accession numbers
in common, as opposed to coordinate comparisons, and constitutive exon
annotations are directly lifted from the "Mm_Ensembl_transcript-annotations.txt"
file, obtained from BioMart.Unlike
the exon array, these constitutive exon annotations are not used to
determine which probe sets are most likely constitutive, since specific
probe sets have been designed for this array to probe predicted constitutive
features, each aligning to multiple exons. The resulting highlighted
exon file is named "Mm_Ensembl_AltMouse_probe sets.txt" and is saved
to "AltDatabase/Mm/AltMouse", with the same structure as its exon array
analogue. 6.3 Extracting UniProt Protein Domain Annotations Overview The UniProt protein database is a highly curated protein database
that provides annotations for whole proteins as well as protein segments
(protein features or domains). These protein feature annotations correspond
to specific amino acid (AA) sequences that are annotated using a common
vocabulary, including a class (feature key) and detailed description
field. An example is the TCF7L1 protein (http://www.uniprot.org/uniprot/Q9HCS4),
which has five annotated feature regions, ranging in size from 7 to
210 AA. One of these regions has the feature key annotation "DNA binding" and the description "HMG box". To utilize these annotations in AltAnalyze,
these functional tags are extracted along with full protein sequence,
and external annotations for each protein (e.g., Ensembl gene) from
the "uniprot_sprot_*taxonomy*.dat" file using the ExtractUniProtFunctAnnot.py program. This program produces two files ("uniprot_feature_file.txt"
and "uniprot_trembl_sequence.txt") that are saved to the appropriate
"AltDatabase/uniprot" species directory. FTP file locations for the UniProt database
file can be found in the file "Config/Default-file.csv" for each supported
species. To improve Ensembl-UniProt annotations, these relationships
are also downloaded from BioMart and stored in the folder "AltDatabase/uniprot/*species*"
as "*species*_Ensembl-UniProt.txt", which are gathered at ExtractUniProtFunctAnnot.py runtime to include in the UniProt sequence
annotation file. These files are saved to "AltDatabase/uniprot/*species*"
as "uniprot_feature_file.txt" and "uniprot_sequence.txt". Runtime is
approximately 5 minutes (not including downloads). 6.4 Extracting Ensembl Protein Domain Annotations Overview In addition
to protein domains/features extracted from UniProt, protein features
associated with specific Ensembl transcripts are extracted from the
Ensembl database. One advantage of these annotations over UniProt, is
that alternative exon changes that alter the sequence of a feature but
not its inclusion will be reported as a gain and loss of the same feature,
as opposed to just one with UniProt. This is because protein feature annotations in UniProt only typically
exist for one isoform of a gene and thus, alteration of this feature
in any way will result in this feature being called regulated. Although
an Ensembl annotated feature with a reported gain and loss can be considered
not changed at all, functional differences can exist do to a minor feature
sequence change that would not be predicted if the gain and loss of
the feature were not reported. Three separate annotation files are built to provide feature sequences and descriptions, "Ensembl_Protein", "Protein", and "ProteinFeatures" files ("AltDatabase/ensembl/*species*"). The "ProteinFeatures" contains relative AA positions for protein features for all Ensembl protein IDs, genomic start and end locations along with InterPro annotations and IDs. Only those InterPro domains/features with an alignment e-score < 1 are stored for alignment to regulated exons. The "Protein" file contains AA sequences for each Ensembl protein. The "Ensembl_Protein " provides Ensembl gene, transcript and protein ID associations. Data for these files are downloaded and extracted the previously mentioned EnsemblSQL.py module. The feature annotation source in these files is InterPro, which provides a description similar to UniProt. As an example, see: http://ensembl.genomics.org.cn/Homo_sapiens/protview?db=core;peptide=ENSP00000282111, which has similar feature descriptions to UniProt for the same gene, TCF7L1. 6.5 Extracting microRNA Binding Annotations Overview To examine
the potential gain or loss of microRNA bindings sites as the direct
result of exon-inclusion or exclusion, AltAnalyze requires putative
microRNA sequences from multiple prediction algorithms. These binding
site annotations are extracted from the following flat files:
Ensembl
gene to microRNA name and sequence are stored for all prediction algorithm
flat files and directly compared to find genes with one or more lines
of microRNA binding site evidence using the program MatchMiRTargetPredictions.py. The flat file produced from this program
("combined_gene-target-sequences.txt") was used by the program ExonSeqSearch.py to search for these putative microRNA
binding site sequences among all probe sets from the "*species*_Ensembl_probe
set.txt" file built by ExonArrayEnsemblRules.py and probe set sequence from the Affymetrix
1.0 ST probe set fasta sequence file (Affymetrix) or the reciprocal
junction highlighted exon sequence file (see section 6.2). Two resulting
files, one with any binding site predictions and another required to
have evidence from at least two algorithms, are saved to "AltDatabase/*species*/*array_type*/"
as "*species*_probe set_microRNAs_any.txt" and "*species*_probe set_microRNAs_multiple.txt",
respectively. 6.6 Inferring Protein-Probe Set Associations Overview To obtain
associations between specific probe sets and proteins, the programs
IdentifyAltIsoforms.py (exon and junction arrays) and ExonSeqModule.py (junction arrays only) were written.
The program IdentifyAltIsoforms.py grabs all gene mRNA transcripts and associated
exon genomic coordinates from Ensembl and UCSC and compares these to
probe set coordinates (or critical exon for junction arrays) to find
pairs of transcripts (one containing the probe set or critical exon
and the other not) that have the least number of differing exons (see
Section 3.4). These transcript pairs are thus most likely to be similar
with exception to the region containing the probe set or critical exon. Once these best matches are identified, corresponding
protein sequences for each mRNA are downloaded from Ensembl using EnsemblSQL.py or are downloaded using NCBI webservices
via BioPython's Entrez function. If protein
sequences are unavailable for an mRNA accession, the mRNA sequence for
that identifier is downloaded (using the above mentioned services) and
translated using the custom IdentifyAltIsoforms.py function "BuildInSilicoTranslations",
which uses functions from the BioPython module to
translate an mRNA based on all possible start and stop sites to identify
the longest putative translation that also shares either the first or
last 5 AA of its sequence with the N-terminus or C-terminus (respectfully)
of a UniProt protein. While this
same protocol is used for junction arrays, prior to this analysis reciprocal
probe sets are mapped to all possible aligning and non-aligning transcripts
through direct probe set sequence comparison via ExonSeqModule.py.This
module takes the consensus probe set sequence for all reciprocal probe
set pairs (defined in the file At this point, only two mRNAs are matched to each probe set or junctions, matching and non-matching mRNAs. Next, differences in protein feature composition between these two proteins, alternative N or C-terminal sequences, coding sequence and protein length are assessed using ExonAnalyze_module.py and exported to text files (associations and protein sequences) for import when AltAnalyze is run. These two files have the suffix "exoncomp.txt". Two analogous files with the suffix "seqcomp.txt", are derived by identifying the best matching and non-matching mRNAs based on comparison of protein sequence as compared exon composition (e.g. least differences in protein domain composition), but are currently used only for internal analyses (contact the authors for the seqcomp files to replace exoncomp). 6.7 Required Files for Manual Update Many external databases are required
for the above build strategies. Advanced users may wish to update databases
using the update.py module in the folder "Source_code" (currently requires
moving all source files to the main directory and running Python through
a terminal program). From there on, you will be presented with several
options. To find or change the download location of any automated downloads,
see the file "Config/Default-file.csv"
and "Config/EnsemblSQL.txt". In the current "Default-file.csv" file,
the web location of all Ensembl files to download is pointed towards
build 49 of Ensembl.To update
the data for a new build of Ensembl, these URL will need to be replaced
with the address of the target build, identified by examining the URLs
in the parent directories. These changes are all that should be required
when downloading a new version of Ensembl, since AltAnalyze will download
and parse these files using the update.py. When updating
the Affymetrix, Ensembl, UniProt and UCSC genome database associations,
the user must ensure that all of these databases are built off the same
genomic build (e.g., NCBI36 aka HG18). Currently, two files must be downloaded manually
from the Affymetrix website (probe set sequence and annotation files
for exon arrays).Additional
functionality and user-interface based control for obtaining AltAnalyze
updates will be included in subsequent builds of AltAnalyze. For the
AltMouseA array, full gene sequences in fasta format with 2kb upstream
and downstream must be downloaded from BioMart in order to update genomic
coordinate alignments for any new NCBI genomic build. Section 7 - Evaluation of AltAnalyze Predictions To assess AltAnalyze exon array analysis
performance relative to other published approaches, we analyzed published
experimental confirmation results for a dataset of splicing factor knockdown
(mouse polypyrimidine tract binding protein (PTB) short-hairpin RNA
(shRNA)). From two independent analyses [11,12], alternative splicing (AS) for 109 probe sets was
assessed in the mouse PTB shRNA dataset by RT-PCR (Supplemental Tables
1,2 and 4 from the referenced study) [12]. Among these, 25 were false positives, one was a
true negative, one undetermined and 81 were true positives. Summary of Published MADS Results In the analysis by Xing et al., alternative
exons discovered by multiple splicing array platforms and RT-PCR were
examined using a new algorithm named microarray analysis of differential
splicing or MADS. MADS implements a modification of the splicing index
method on gene expression values obtained using multiple scripts from
GeneBase and filtering of probes predicted to hybridize to multiple
genomic targets. Using this algorithm, the authors were able to verify
AS detected by RT-PCR of mouse Affymetrix Exon 1.0 array data as well
as predict and validate 27 novel splicing events by RT-PCR. Using the
microarray CEL files posted by Xing and colleagues, we ran AltAnalyze
using default options (same as used in the corresponding primary report),
which includes quantile normalization via RMA-sketch using AltAnalyze's
interface to Affymetrix Power Tools. AltAnalyze Results Of the 109 probe sets linked to splicing
events characterized by RT-PCR, 78 were analyzed by AltAnalyze. Those
probe sets not analyzed by AltAnalyze were either not apart of the AltAnalyze
"core" probe sets or were excluded due to high detection p-value or
low expression thresholds. A break-down of the number of RT-PCR true
positive, false positive, undetermined and false negative (out of the
81 documented true positives) is shown for various AltAnalyze filters
(Table 7.1). Of the 78 analyzed probe sets, 26
were called by AltAnalyze to be alternatively regulated (using default
parameters), out of 194 probe sets called by AltAnalyze as alternatively
regulated. All 26 probe sets were annotated as true positives according
to the published RT-PCR data. Although 17 probe sets were RT-PCR false
positives among the 78 probe sets with RT-PCR data and analyzed by AltAnalyze,
only one false positive was observed with any of the AltAnalyze filters
alone (splicing-index p<0.05 alone without additional default options).
The MADS algorithm was able to validate AS for 27 novel splice events
corresponding to 41 probe sets. Of these 41 probe sets, 33 were analyzed
by AltAnalyze and 23 were considered alternatively regulated. Conclusions This analysis suggests that AltAnalyze
analysis using default parameters produces conservative results with
high specificity (100% true positives in this analysis) with reasonable
sensitivity(~42% that of MADS).
For smaller datasets, such as the PTB knock-down comparison, the decreased
sensitivity results will have a significant impact on the number of
true splicing events detected, however, for larger datasets with thousands
of regulated probe sets, AltAnalyze is likely to produce a reduction
in the number of false positives and reduction in overall noise. It
is important to note however, for the MADS analysis only a p-value threshold
was used and for AltAnalyze, both a MiDAS and splicing-index p-value
in addition to splicing-index fold change thresholds were used. For
these analyses, we have not filtered probe sets based on association
with annotated splicing events (see Materials and Methods for description),
which should further decrease false positives. If probe sets with annotated
splicing events are filtered out, 20 versus 26 true positives will remain. Although a false positive rate of
up-to 50% has been reported with the conventional splicing-index implementation
(e.g., using the Affymetrix ExACT software) [12], AltAnalyze's analysis differs in several ways. First, in this analysis RMA-sketch was used as the method for
quantile normalization. After obtaining expression values for probe
sets (no low level filtering currently implemented), probe sets for
each of the two biological groups are filtered based on two main parameters:
DABG p-value and mean expression filters. Any probe set with a DABG
p-value > 0.05 in both biological groups or mean expression <
70 are excluded. Additional AltAnalyze specific parameters
relate to how probe set to gene associations are obtained, which probe
sets are selected for analysis and how probe sets are selected for calculation
of gene expression. Unlike ExACT, probe set to gene association are
via genomic coordinate alignment to Ensmebl/UCSC mRNA transcripts for
unique Ensembl genes rather than to Affymetrix transcript clusters.
This process ensures that a probe set only aligns to one Ensembl gene.
Probe sets can align to an exon, intron or UTR of a gene. Any probe
set aligning to an analyzed mRNA is used for analysis in the AltAnalyze
"core" set along with any Affymetrix annotated "core" probe set. To
determine gene expression from the exon-level a two-step method is employed.
First, probe sets that are most over-represented among mRNAs or mRNAs
and ESTs (associations from Affymetrix probe set annotation file) are
selected as constitutive. Next if constitutive probe set is "expressed"
in both biological groups (using the DABG and mean expression filters
listed above), the probe set is retained for constitutive expression
calculation. If more than one "expressed" constitutive probe set is
present, the mean expression of all constitutive probe sets for each
array is calculated.As a final
step, probe sets with an associated gene expression difference between
the two array groups greater than 3 are not reported. These analysis
steps result in a unique splicing-index, splicing-index t-test p-value
and MiDAS p-value calculation from other analysis methods. Since this validation set provides
a limited test case for analysis of type I (false positive) and type
II (false negative) errors, the AltAnalyze algorithms will continue
to be assessed as additional validation data is made available. Future
implementations will likely include "low-level" analyses that reduce
the occurrence of type I errors (e.g., elimination of expression data
for specific probes that introduce additional noise). However, this
data supports the concept that AltAnalyze produces conservative results
with a level of confidence.
Section
8 - Analysis of AltAnalyze Results DomainGraph
Once
alternative probe sets have been identified from an AltAnalyze exon
array analysis, you can easily load this data in the Cytoscape plugin
DomainGraph to: 1)
Visualize
interaction networks between proteins and specific protein domains. 2)
Assess
which probe sets overlap with a set of loaded genes and which specific
protein domains at a high-level (protein/domain network/pathway) and
low-level (domain/exon/probe set view). 3) Immediately see which probe sets overlap with known/predicted
alternative splicing events, alternative promoter selection or microRNA
binding sites. 4) View alternative probe set data in the context of
WikiPathways and Reactome gene networks.
Installing DomainGraph Please
note, the below instructions pertain to DomainGraph 2.0 and will be
updated with the next major release, including use of the new DomainGraph
output file format produced by AltAnalyze 1.1. 1) Prior to installing DomainGraph, go
to http://www.cytoscape.org and download the latest version of Cytoscape. 2) DomainGraph, like most other Cytoscape
plugins, can be downloaded within Cytoscape, after installation by choosing
the Plugins>Manage Plugins>Network Inference menu. DomainGraph
will be listed under the "Available for Install" plugins.
If you believe this plugin is outdated or you wish to access additional
information on DomainGraph, go to http://domaingraph.bioinf.mpi-inf.mpg.de/. 3) After installation, go to the menu Plugins>DomainGraph>ManageGaph
database>Import data for selected species into database. 4) Next, you will be asked to register
your installation of DomainGraph (DomainGraph is currently free ONLY
for non-commercial use). After filling out the form, choose to accept
the user agreement and select OK. You will receive a registration key
by email. 5) Enter the registration key into the
bottom of the registration form you filled out. If closed, you can access
this again by performing step 3. 6) Repeat step 3 and download the DomainGraph
database for your species. AltAnalyze currently supports mouse and human
analyses. Database download can take several minutes. 7) Once finished, you are ready to import
a gene network and AltAnalyze results. Obtaining AltAnalyze Input for
DomainGraph DomainGraph analyses are compatible
with data from Affymetrix Exon 1.0 arrays. To get AltAnalyze results,
you must be analyzing data from this array platform. Download AltAnalyze
from the AltAnalyze website. Of the several result files created by
AltAnalyze for every pair-wise comparison (experimental group compared
to a control group of arrays), the dataset file in the AltResults/DomainGraph
folder of the user-defined output directory. Importing and Running DomainGraph
with AltAnalyze Detailed
and updated instructions for each new DomainGraph version are provided
online at: http://groups.google.com/group/alt_predictions/web/visualizing-altanalyze-results-in-domaingraph. 1. Cline MS, Smoot M, Cerami E, Kuchinsky
A, Landys N, et al. (2007) Integration of biological networks and gene
expression data using Cytoscape. Nat Protoc 2: 2366-2382. 2. Hubbard
TJ, Aken BL, Beal K, Ballester B, Caccamo M, et al. (2007) Ensembl 2007.
Nucleic Acids Res 35: D610-617. 3. Karolchik
D, Kuhn RM, Baertsch R, Barber GP, Clawson H, et al. (2008) The UCSC
Genome Browser Database: 2008 update. Nucleic Acids Res 36: D773-779. 4. Salomonis
N, Hanspers K, Zambon AC, Vranizan K, Lawlor SC, et al. (2007) GenMAPP
2: new features and resources for pathway analysis. BMC Bioinformatics
8: 217. 5. van Iersel
MP, Kelder T, Pico AR, Hanspers K, Coort S, et al. (2008) Presenting
and exploring biological pathways with PathVisio. BMC Bioinformatics
9: 399. 6. Srinivasan
K, Shiue L, Hayes JD, Centers R, Fitzwater S, et al. (2005) Detection
and measurement of alternative splicing using splicing-sensitive microarrays.
Methods 37: 345-359. 7. Gardina
PJ, Clark TA, Shimada B, Staples MK, Yang Q, et al. (2006) Alternative
splicing and differential gene expression in colon cancer detected by
a whole genome exon array. BMC Genomics 7: 325. 8. Ule J, Ule
A, Spencer J, Williams A, Hu JS, et al. (2005) Nova regulates brain-specific
splicing to shape the synapse. Nat Genet 37: 844-852. 9. Wheeler
R (2002) A method of consolidating and combining EST and mRNA alignments
to a genome to enumerate supported splice variants Algorithms in Bioinformatics:
Second International Workshop, Springer Berlin / Heidelberg Volume 2452/2002: 201-209. 10. Sugnet
CW, Srinivasan K, Clark TA, O'Brien G, Cline MS, et al. (2006) Unusual
intron conservation near tissue-regulated exons found by splicing microarrays.
PLoS Comput Biol 2: e4. 11. Boutz PL,
Stoilov P, Li Q, Lin CH, Chawla G, et al. (2007) A post-transcriptional
regulatory switch in polypyrimidine tract-binding proteins reprograms
alternative splicing in developing neurons. Genes Dev 21: 1636-1652. 12. Xing Y,
Stoilov P, Kapur K, Han A, Jiang H, et al. (2008) MADS: a new and improved
method for analysis of differential alternative splicing by exon-tiling
microarrays. Rna 14: 1470-1479. |
|||||||||||||||||||||||||||||||||||||||||||||||||||||||||||||||||||||||||||||||||||||||||||||||||||||||||||||